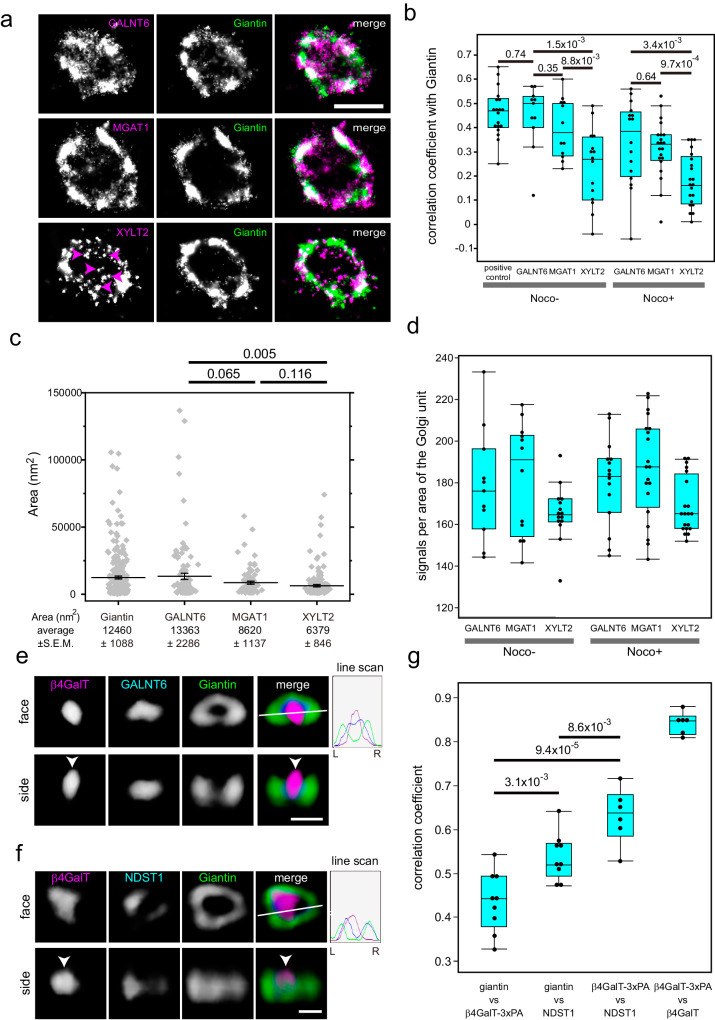
Fig. 2. Distribution of glycosylation enzymes observed by STORM and SCLIM.
a STORM 2D imaging of the isolated Golgi unit in en face view of nocodazole-treated KI cells stained with antibodies against the PA tag and giantin. Upper panels: GALNT6-3xPA KI cells. Middle panels: MGAT1-3xPA KI cells. Lower panels: XYLT2-3xPA KI cells. Arrowheads indicate punctate staining of XYLT2. Bar, 1 µm. b STORM 2D colocalisation analysis among KI cells treated with and without nocodazole. Statistical significance was determined by two-tailed unpaired t test. In b–d, number of cells: 4 (GALNT6, MGAT1: nocodazole-), 5 (XYLT2: nocodazole-) and 6 (nocodazole + ). In b, c,, g, P values are depicted in the graph. In b, d, g, boxes represent 25% and 75% quartiles, lines within the box represent the median, and whiskers represent the minimum and maximum values within 1.5 x the interquartile range. c Distribution of areas of the zones of various glycosylation enzymes and giantin. The areas of individual zones (grey dots) in STORM images were determined using the Voronoi-based segmentation method (see Methods section for details). Error bars represent the standard error of the mean (SEM). Statistical significance was determined by Welch’s two-tailed t test. N = 263, 107, 81, and 148 for giantin, GALNT6, MGAT1, and XYLT2, respectively. d Distributions of signal intensities in one Golgi unit of cells treated with and without nocodazole. e, f SCLIM 3D imaging of GALNT6-3xPA KI cells stained with antibodies against β4GalT1, PA tag, and giantin (e) and that of β4GalT1-3PA + NDST1-9xMyc KI cells stained with antibodies against the PA tag, Myc tag, and giantin (f). Arrowheads denote the localisation of β4GalT at the centre of the Golgi unit. The fluorescence intensity profile from left (L) to right (R) in the right upper panels is indicated on the right. Bars, 1 µm. g SCLIM 3D colocalisation analysis among β4GalT1, NDST1, and giantin. The right bar shows the colocalization coefficient of PA tags with β4GalT1 in β4GalT1-3xPA KI cells, which only have KI alleles (Supplementary Fig. 1c, d). Each point represents the value from one cell. Thus, the number of cells is more than 6. Statistical significance was determined by two-tailed unpaired t test. Imaging modalities and acquisition parameters of SCLIM are described in the materials and methods.

