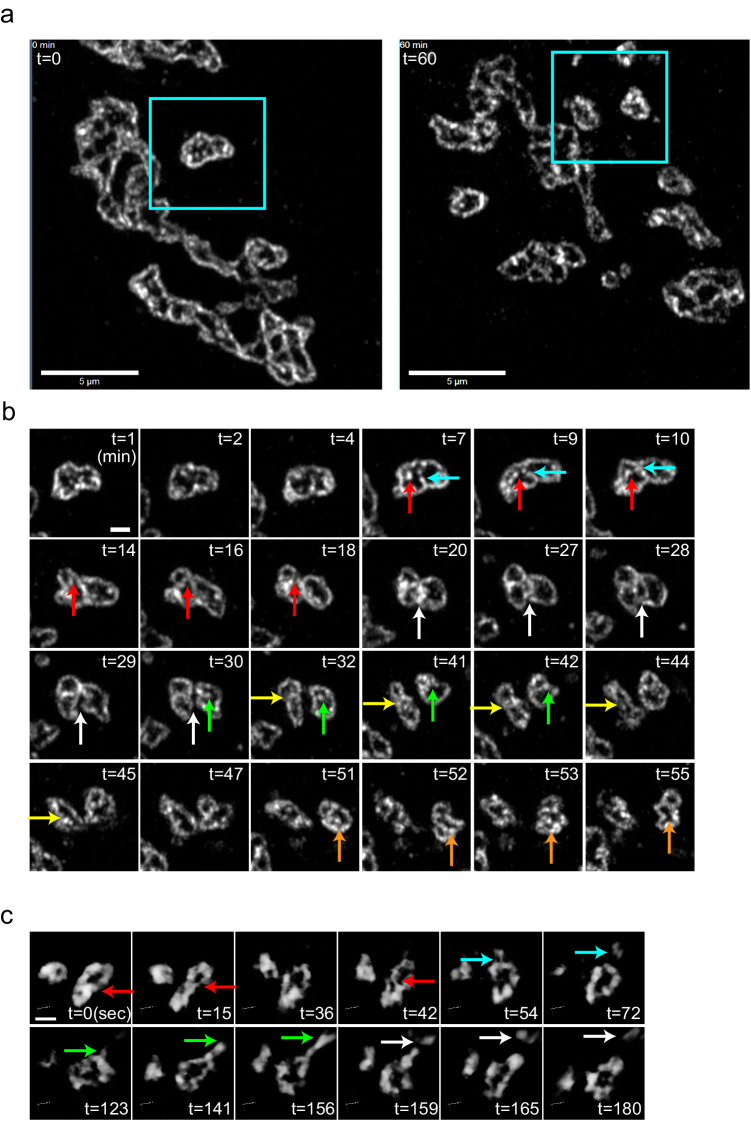
Fig. 5. Live imaging of the Golgi shows its dynamic movements, separation, and fusion.
a 2D Live imaging of Caco2 cells expressing mNeonGreen-giantin by Airyscan confocal microscopy (Supplementary Movie 4). Left: 0 min, Right: 60 min. Low magnification micrographs of the Golgi in the absence of nocodazole. Areas in the rectangles are observed for 60 minutes in b. Bars, 5 µm. b Deformation, separation, fusion, attachment and detachment of the Golgi units. Separation events are indicated by red and blue arrows (7–18 min), green arrows (30–42 min), and orange arrows (51-52 min). Fusion events are indicated by yellow arrows (32–45 min) and orange arrows (52-55 min). Detachment of two units is shown by white arrows (20–30 min). Bar, 1 µm. c Live imaging of Caco2 cells expressing mNeonGreen-golgin-84 imaged by SCLIM in 3D at higher time resolution in three dimension (Supplementary Movie 5). During fusion, a partition between units (red arrows) is present during 0-15 sec, disappears transiently at 36 sec, reappears at 42 sec, and finally disappears at 54 sec. From 54 to 72 sec, a part of the rim of the Golgi unit elongates and is cleaved and transported away (blue arrows). From 123 to 156 sec, a part of the rim elongates (green arrows). It is cleaved in the middle of the extension and is transported away (white arrows). Frame rate is 3 seconds/frame (3 seconds/volume). Bar, 1 µm. Images are representative of at least three independent biological replicates. Imaging modalities and acquisition parameters of SCLIM are described in the materials and methods.

