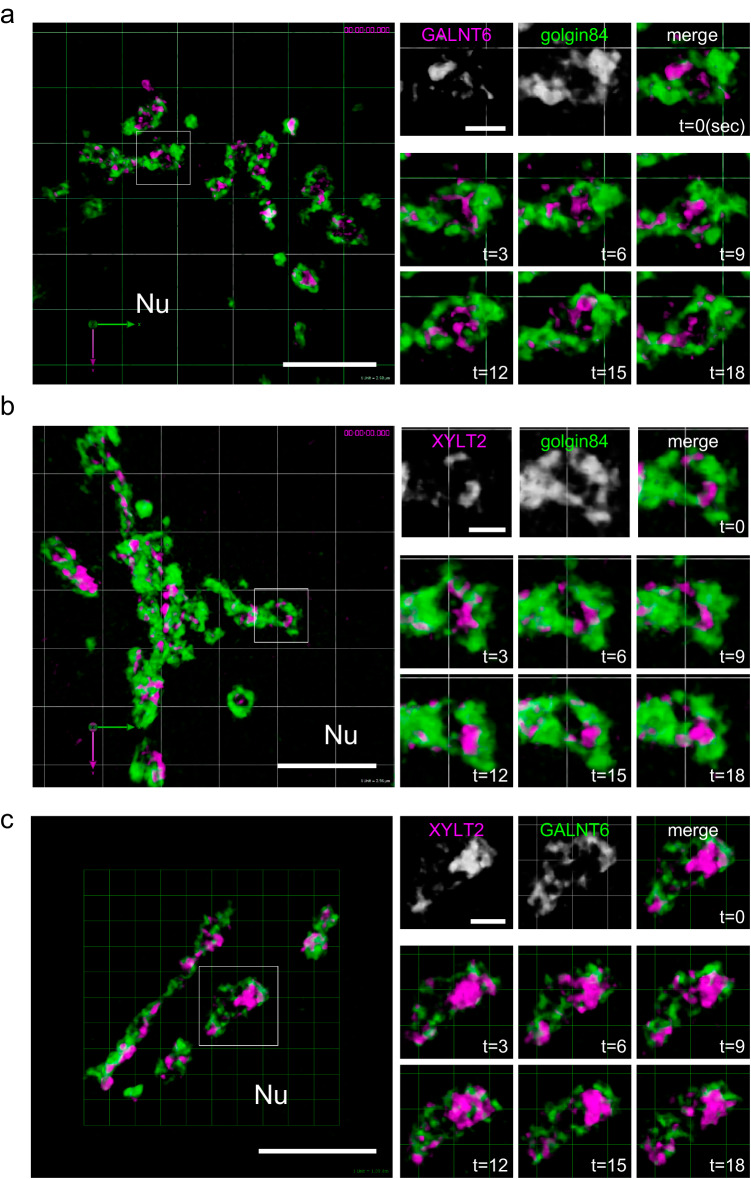
Fig. 6. Live imaging of the zones of glycosylation enzymes.
a 3D live imaging of a GALNT6-Halo-3xPA KI cell transfected with mNeonGreen-golgin-84 by SCLIM (Supplementary Movie 9). Left: A low magnification micrograph of the Golgi near the nucleus (Nu). A region in the small rectangle is magnified in the right panels. Right: Top panels show GALNT6, golgin-84 and merged micrographs at 0 sec. Middle and bottom panels show the movement of GALNT6 in the Golgi unit surrounded by golgin-84 from 3 to 18 sec. A large part of the GALNT6 signal is localised near or on the rim of the unit. Frame rate is 3 seconds/frame (3 seconds/volume). Bar, 5 µm (left), 1 µm (right). b 3D live imaging of a XYLT2-Halo-3xPA KI cell transfected with mNeonGreen-golgin-84 (Supplementary Movie 10). Left: a low magnification micrograph of the Golgi near the nucleus (Nu). A region in the small rectangle is magnified in the right panels. Right: Top panels show XYLT2, golgin-84 and merged micrographs at 0 sec. Middle and bottom panels show the movement of XYLT2 in the Golgi unit surrounded by golgin-84 from 3 to 18 sec. Frame rate is 3 seconds/frame. Bar, 5 µm. c 3D live imaging of an XYLT2-Halo-3xPA + GALNT6-2xSNAP-9xMyc double KI cell (Supplementary Movie 13). Left: a low magnification micrograph of the Golgi near the nucleus (Nu). A region in the small rectangle is magnified in the right panels. Right: Top panels show XYLT2, GALNT6, and merged micrographs at 0 sec. Middle and bottom panels show the movements of XYLT2 (magenta) and GALNT6 (green) in the Golgi unit from 3 to 18 sec. They are localised almost mutually exclusively. Frame rate is 3 seconds/frame. Bars, 5 µm (left), 1 µm (right).

