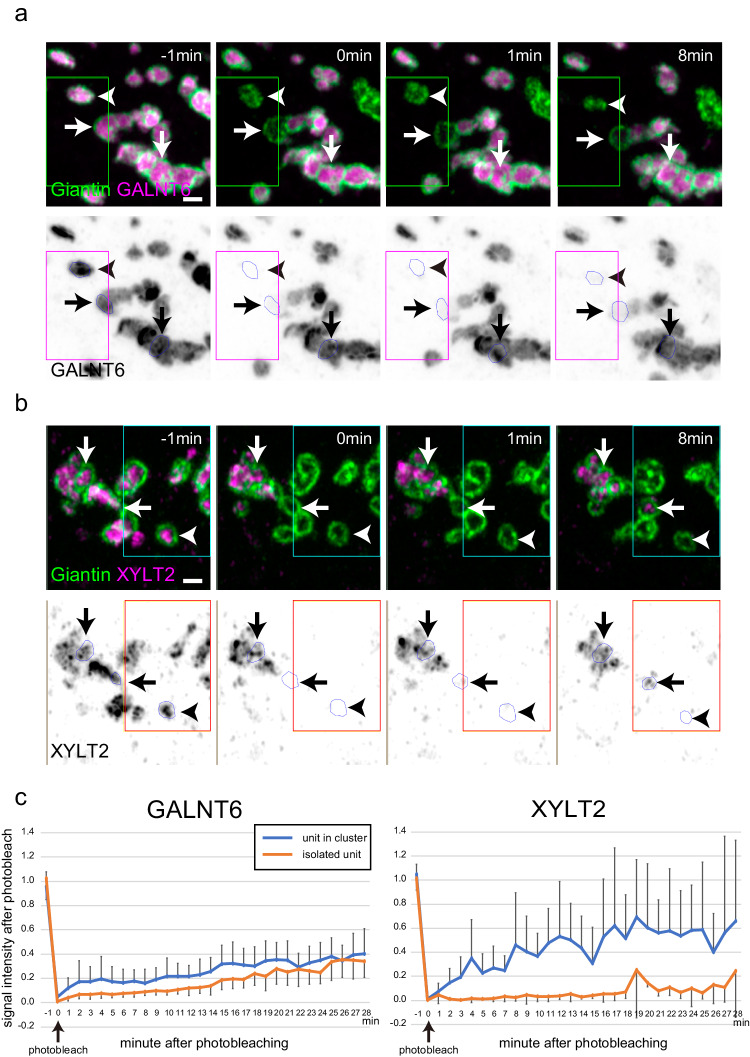
Fig. 7. Photobleaching of a GALNT6 and XYLT2 KI cell transfected with mNeonGreen-giantin.
a Photobleaching of a GALNT6-Halo-3xPA KI cell transfected with mNeonGreen-giantin and observed by 2D Airyscan imaging (Supplementary Movie 14). Top panels: GALNT6 and giantin signals are shown in magenta and green, respectively. A region around the green rectangle is bleached at 0 min. Bottom panels: GALNT6 signals are shown in black. A region around the red rectangle is bleached at 0 min. Arrowheads: A bleached single unit, Horizontal arrows: A bleached unit in cluster. Vertical arrows: a unit in the nonbleached region. Bar, 1 µm. b Photobleaching of an XYLT2-Halo-3xPA KI cell transfected with mNeonGreen-giantin and observed by 2D Airyscan imaging (Supplementary Movie 15). Top panels: XYLT2 and giantin signals are shown in magenta and green, respectively. A region around the green rectangle is bleached at 0 min. Bottom panels: XYLT2 signals are shown in black. A region around the red rectangle is bleached at 0 min. Arrowheads: A bleached single unit, Horizontal arrows: A bleached unit in cluster. Vertical arrows: a unit in the nonbleached region. Bar, 1 µm. c Time-dependent FRAP measurements on GALNT6-Halo and XYLT2-Halo and quantification of FRAP recovery as a function of time until 28 min after photobleaching by 2D Airyscan imaging. Orange and blue lines indicate averaged Halo signals in an isolated single unit and a unit in a cluster, respectively. Graphs of signals from individual experiment are shown in Supplementary Fig. 7b, c. N = 5 for each. Error bars represent SEM. In a–c, images are representative of at least three independent biological replicates.

