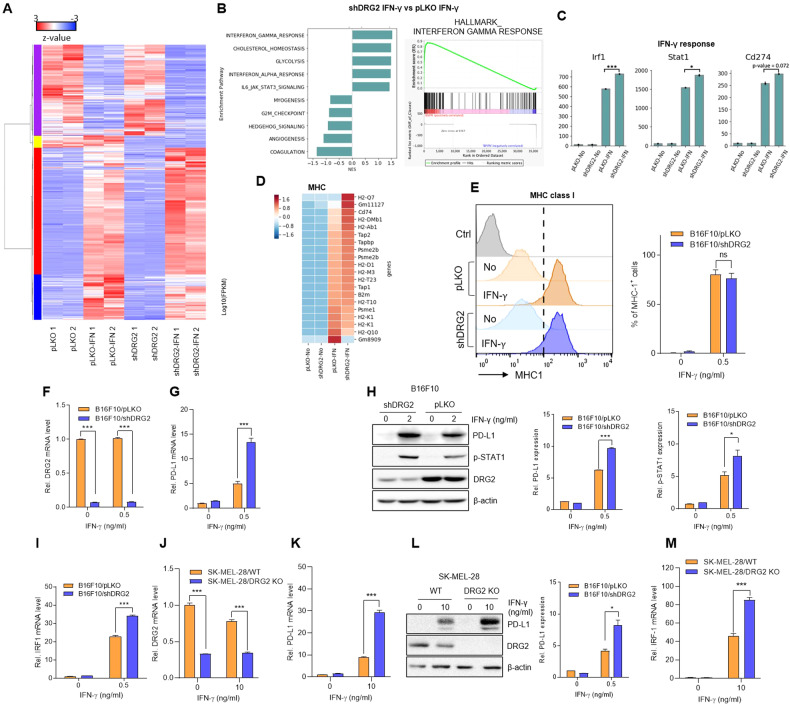
Fig. 2. DRG2 deficiency enhances IFN-γ responses and PD-L1 expression in melanoma cells.
A–D RNA-Seq analysis. A Heatmap of 500 DEGs in non-treated and IFNγ-treated B16F10/pLKO and B16F10/shDRG2 cells. B Gene set enrichment analysis (GSEA). Bar plot of enriched GSEA pathways in IFNγ-treated B16F10/pLKO cells vs. IFNγ-treated B16F10/pLKO cells. Enrichment plot of IFNγ responses positively enriched in IFNγ-treated B16F10/shDRG2 cells. C Expression of genes involved in IFNγ response in non-treated and IFNγ-treated B16F10/pLKO and B16F10/shDRG2 cells. The y-axis corresponds to fragments per kilobase of exon model per million mapped reads (FPKM) measured by RNA-Seq (EdgeR at FDR < 0.05). Student’s t test. *P < 0.05; ***P < 0.001. See also Supplementary Fig. S2. D Heatmap of MHC genes in non-treated and IFNγ-treated B16F10/pLKO and B16F10/shDRG2 cells. E–I B16F10/pLKO and B16F10/shDRG2 cells were treated with indicated concentration of IFNγ for 24 h. E FACS analysis for MHC class I expression in IFNγ-treated B16F10/pLKO and B16F10/shDRG2 cells. Flow cytometry graphs and quantification of the proportion of cells showing IFNγ-induced expression of MHC class I (dotted line). G qRT-PCR analysis for PD-L1. H Representative Western blot images and relative densitometric bar graphs of PD-L1 and phosphorylated STAT1. Fold change in expression levels was calculated relative to the values of non-treated B16F10/pLKO cells. I qRT-PCR analysis for IRF1. J–M SK-MEL-28/WT and SK-MEL-28/DRG2 KO human melanoma cells were treated with 10 ng/ml IFNγ for 24 h. J qRT-PCR analysis for DRG2. K qRT-PCR analysis for PD-L1. L Representative Western blot images and relative densitometric bar graphs of PD-L1. Fold change in expression levels was calculated relative to the values of non-treated wild-type SK-MEL-28 cells. M qRT-PCR analysis for IRF1. Values are the mean ± SD of two independent experiments (n = 3 per group per experiment). Student’s t test. *P < 0.05; ***P < 0.001. ns not significant. See also Supplementary Fig. S3.

