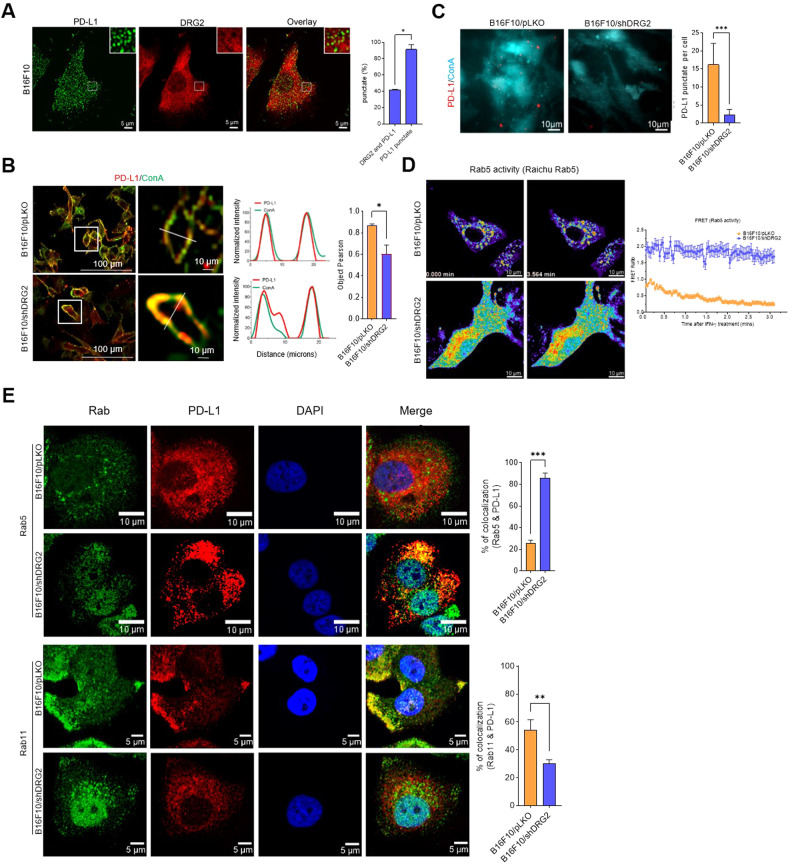
Fig. 4. DRG2-depleted melanoma cells show defects in recycling of endosomal PD-L1 and accumulation of PD-L1 at Rab5-endosomes.
A Representative confocal images of B16F10 cells incubated with anti-DRG2 and anti-PD-L1 at 24 h after IFN-γ treatment. Graph represents % of DRG2-containing puncta among PD-L1-puncta. B Representative confocal images of B16F10/pLKO and B16F10/shDRG2 cells incubated with ConA and anti-PD-L1 antibody after IFN-γ treatment. Line graphs represent linear pixel values across cells. Bar graph represents PD-L1 colocalization with ConA in terms of the Pearson’s correlation coefficient (mean ± SD from two experiments, with 20 different cells per group per experiment). *P < 0.05. C Representative TIRF images of B16F10/pLKO and B16F10/shDRG2 cells incubated with ConA and anti-PD-L1 antibody after IFN-γ treatment. Bar graph represents number of PD-L1 puncta per cell in the TIRF images (mean ± SD from two experiments, with 20 different cells per group per experiment). ***P < 0.001. D FRET images of B16F10/pLKO and B16F10/shDRG2 cells expressing Raichu-Rab5 at indicated time point after IFN-γ treatment. Graph shows FRET/CFP ratio at indicated times. E Representative confocal images of B16F10/pLKO and B16F10/shDRG2 cells incubated with anti-DRG2, anti-PD-L1, anti-Rab5, and anti-Rab11 at 30 min after IFN-γ treatment. Blue, DAPI staining. Graph represents Pearson’s R(r) between PD-L1 and Rab5 or Rab11 (mean ± SD from two experiments, with 20 different cells per group per experiment). **P < 0.01; ***P < 0.001. See also Supplementary Fig. S5.

