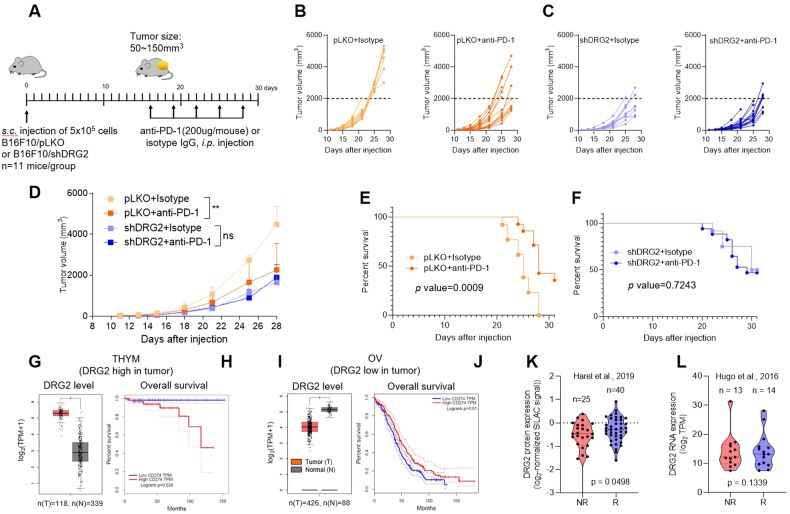
Fig. 5. DRG2 deficiency in cancer cells hinders the anti-tumor activity of anti-PD-1 immunotherapy.
A Schematic representation of the treatments applied to mice that were subcutaneously (s.c.) engrafted with B16F10 melanoma cells. B, C Individual growth of tumors over time in (B) B16F10/pLKO or (C) B16F10/shDRG2 tumor-containing mice treated with negative control (isotype) or anti-PD-1. Arrows represents anti-PD-1 treatment. D Average tumor sizes from experiment shown in (B, C). The data are expressed as means ± SD. Two-way ANOVA, **P < 0.01. E, F Overall survival of (E) B16F10/pLKO or (F) B16F10/shDRG2 tumor-containing mice treated with IgG or anti-PD-1. P values were calculated using a two-sided log-rank test. G–J Kaplan–Meier survival curves of cancer patients in TCGA according to DRG2 and PD-L1 expression. G, I Boxplots for DRG2 expression level in terms of log2(TPM + 1) in the tumor (red) and normal (grey) samples and H, J Kaplan–Meier overall survival curve of (G, H) thymoma (THYM) patients with high DRG2 expression in tumors and I, J ovarian serous cystadenocarcinoma (OV) patients with low DRG2 expression in tumors. For Kaplan–Meier plots, patients were split into two equal-sized groups with the median of CD274 (PD-L1) level as the cutoff. One-way ANOVA was used to assess the difference in DRG2 expression. *P < 0.05. Log-rank tests were used to assess the difference in patient survival times between the two groups. K, L Relationship between (K) protein and (L) mRNA expression level of DRG2 and anti-PD-1 responses in the anti-PD-1 response cohorts. The middle line in the graph is the mean. To assess the differences in DRG2 expression between anti-PD-1 responding (R) and non-responding groups (NR) robustly, the Student t test was used, and the P value from a permutated random distribution is shown on the plot.

