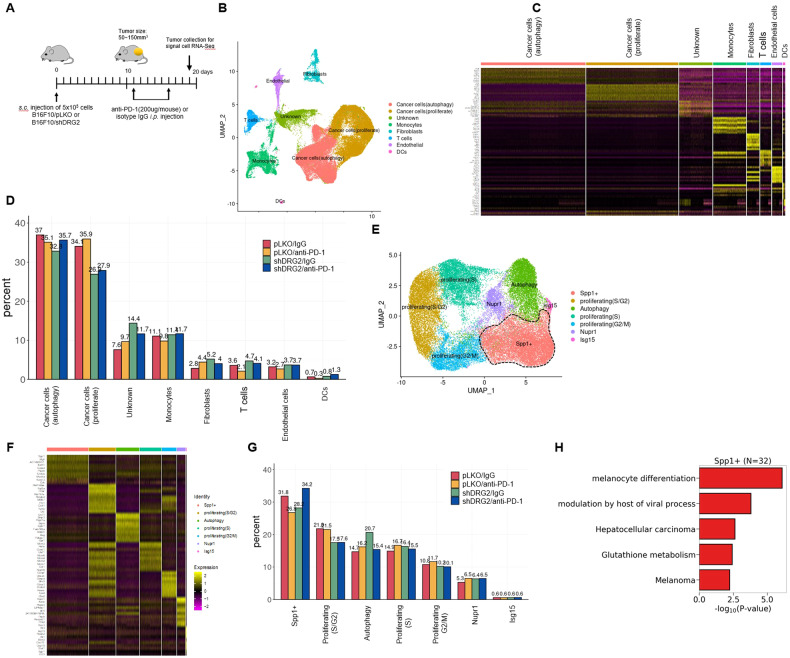
Fig. 6. Single-cell RNA-Seq analysis reveals subcluster of DRG2-depleted melanoma cells resistant to anti-PD-1 immunotherapy.
A Schematic representation of the treatments applied to mice that were subcutaneously (s.c.) engrafted with B16F10 melanoma cells. B–D Profiling single cells in B16F10/pLKO or B16F10/shDRG2 tumors treated with negative control (IgG) or anti-PD-1. B Uniform manifold approximation and projection (UMAP) map of 62,956 cells color-coded for the indicated cell type. C Relative expression of the top-10 most differentially expressed genes for each cell clusters. Cluster-defining genes are shown in Supplementary Fig. S6. D Relative contribution of each cell cluster (in %) in B16F10/pLKO or B16F10/shDRG2 tumors treated with negative control (IgG) or anti-PD-1. E UMAP of 41,412 cancer cells showing 7 subclusters of cancer cells indicated by the color-coded legend. F A heatmap based on relative expression of the top-10 most differentially expressed genes for each cell subclusters. Subcluster-defining genes are shown in Supplementary Fig. S7. G Relative contribution of each cancer cell subcluster (%) in B16F10/pLKO or B16F10/shDRG2 tumors treated with negative control (IgG) or anti-PD-1. H Pathway analysis of the top five molecular signatures distinguishing cancer cell “Spp1 + ” subcluster.

