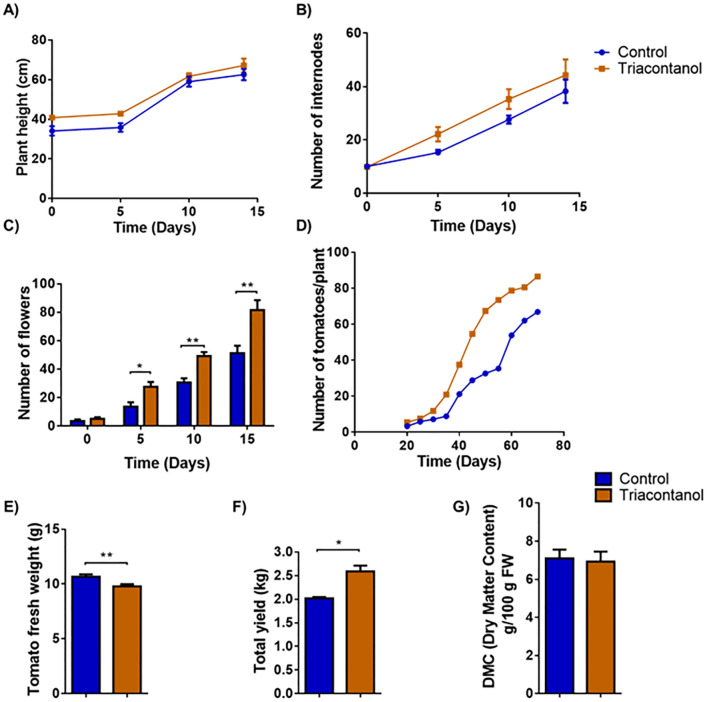
Figure 1.
Phenotypical parameters and fruit yield of triacontanol-biostimulated and control plants. Four-week plants were biostimulated weekly with a foliar application of 70 µM triacontanol. (A) plant height, (B) number of internodes, (C) number of flowers of biostimulated plants, measured 15 days after the first biostimulation. (D) Number of fruits per plant, determined starting from day 20 after the first biostimulation. (E) mean fresh weight, (F) total yield, (G) dry matter content (g/100 fresh weight) of fruits at harvest. Error bars are s.e.m. of three independent experiments. For each experiment, eight plants/group were analyzed. * p < 0.05, ** p < 0.01, by Student’s t-test.

