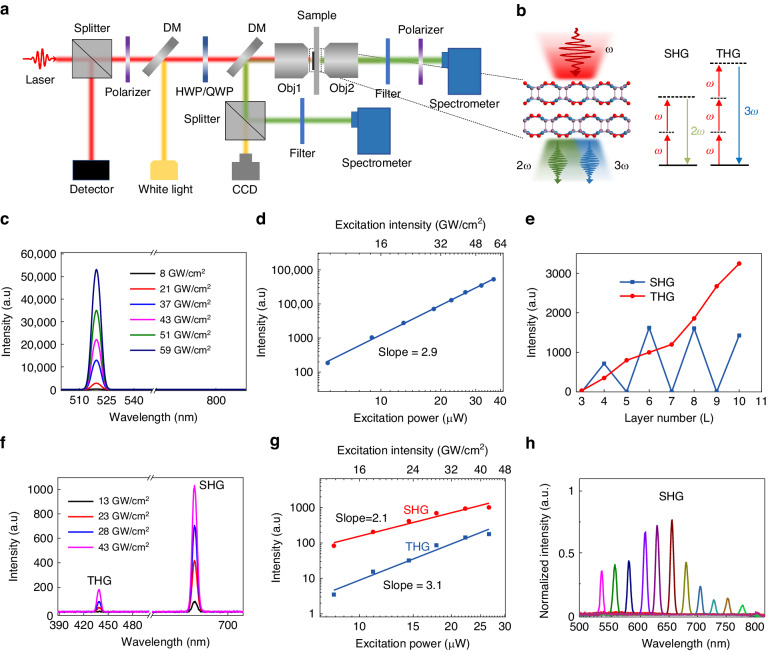
Fig. 2.
SHG and THG processes in 2D PdPSe. a Schematic diagram of the THG and SHG experimental setup. b Left: Schematic illustration of the SHG and THG processes in the inversion symmetry broken 2D PdPSe; Right: the schematic diagram for the SHG and THG processes. c THG spectra depending on the excitation intensity for the PdPSe flake with a thickness of 28 nm under 1550-nm excitation. d Excitation power (intensity) dependent THG intensity in the bulk PdPSe with a thickness of 28 nm. e SHG and THG intensities as functions of the layer number (L). f SHG and THG spectra of 6 L PdPSe under 1300-nm excitation. The peaks at 433 and 650 nm correspond to the THG and SHG signals, respectively. g Excitation power (intensity) dependent SHG and THG intensities in 6 L PdPSe. h The SHG spectra with the excitation wavelength from 1064 to 1600 nm in 4 L PdPSe

