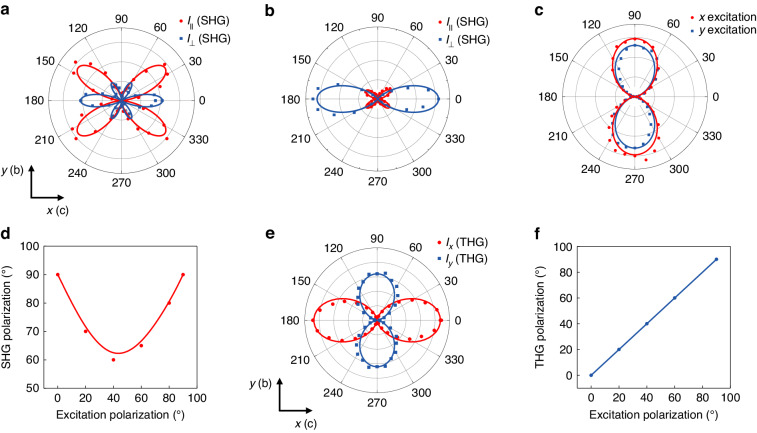
Fig. 3.
Anisotropic SHG and THG processes in 6 L 2D PdPSe. a, b Polar plots of the SHG intensity versus the polarization angle (θ) with parallel (red) and perpendicular (blue) configurations under 1550-nm and 980-nm excitations. c SHG polarization orientation with excitation polarization along x-(red) and y-(blue) axes of PdPSe under 1300-nm excitation. d SHG polarization orientation depending on the excitation polarization. e Polar plots of angular dependence of the THG intensity on the excitation polarization at 1550 nm. 0° corresponds to the x-axis. Red (blue) data points are measured x (y)-component of the THG signal, respectively. The solid curves are corresponding theoretical fittings. f THG polarization orientation depending on the excitation polarization

