Fig. 4.
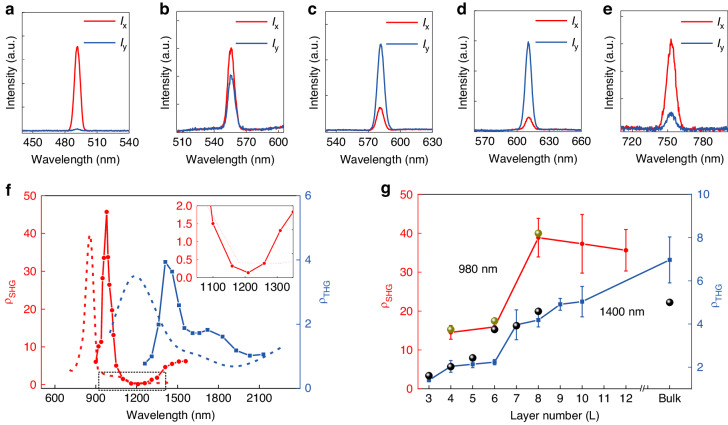
Anisotropic ratios versus the excitation wavelength and the layer number. a–e SHG spectra (8 L PdPSe) for the excitation polarization along x (y)-axis (Ix and Iy) with different excitation wavelengths (a 980 nm; b 1100 nm; c 1150 nm; d 1210 nm; e 1510 nm). f (red) and (blue) versus the excitation wavelength for 8 L PdPSe. Red (blue) dashed lines represent calculated () depending on the excitation wavelength. Inset: the amplified spectral region marked by the dashed rectangle. g (red) and (blue) as functions of the layer number under 980- and 1400-nm excitations, respectively. Green (at 850 nm) and black (at 1190 nm) dots represent calculated results

