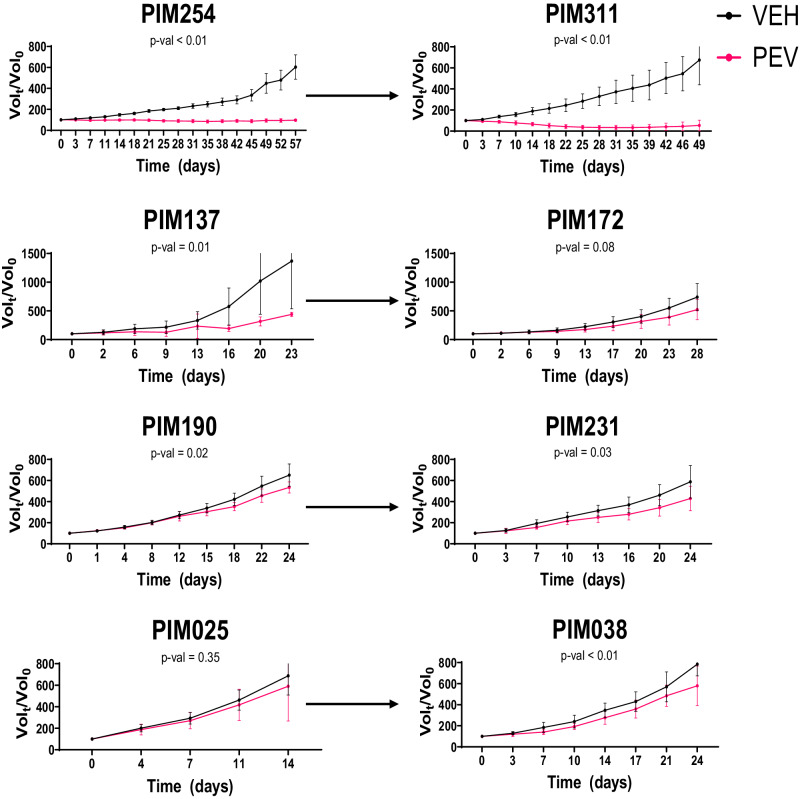
Fig. 4. In vivo efficacy study of pevonedistat.
Tumor volume growth curves for individual PDX models treated either with vehicle (black) or pevonedistat (red). Statistical significance denoted under the PDX_ID, was determined using a two-way ANOVA applied to the time series. Arrows connect paired models, with pre-NACT models on the left and corresponding mid/post-NACT models on the right. Data points and error bars show the mean and standard deviation respectively.

