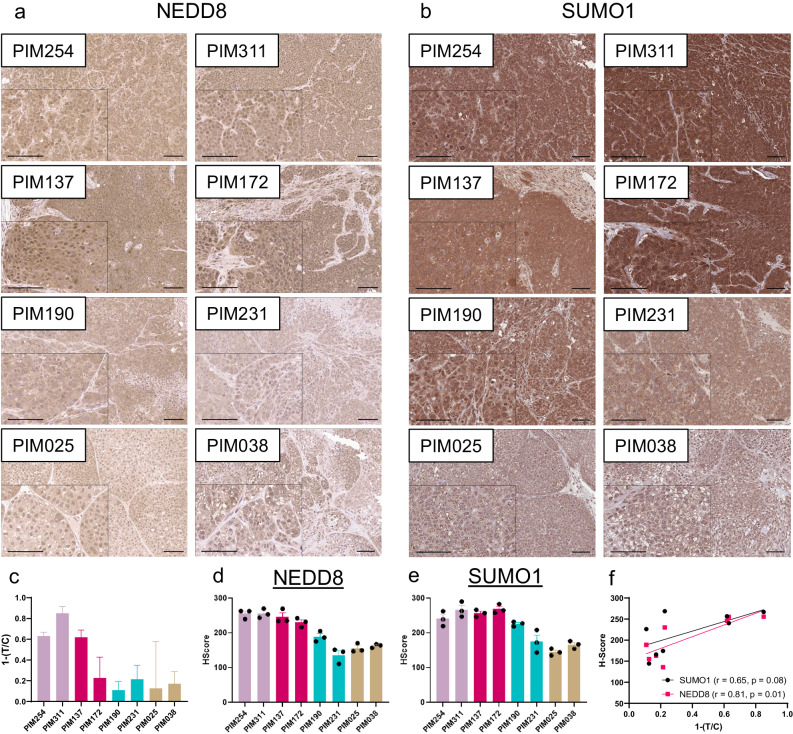
Fig. 5. NEDD8 and SUMO1 tissue labeling.
Representative images of NEDD8 (a) and SUMO1 (b) IHC in PDX tumor sections. Images shown are ×10 magnification, insets are ×20 magnification, and scale bars are 100 µm. c Bar chart showing PDX response to pevonedistat via normalized tumor to control ratios (T/C). Bars represent mean ± standard deviation. H-scores for NEDD8 (d) and SUMO1 (e) intensity, combining percent of tumor cells staining and intensity of staining. Images were quantified from three tumors per PDX model. Bars represent the mean ± SEM. f Dot plot showing the correlation of pevonedistat response (1-T/C) of SUMO1 H-Score (black) or NEDD8 H-score (Red). r = Spearman correlation coefficient, p = p value calculated from a two-tailed test.

