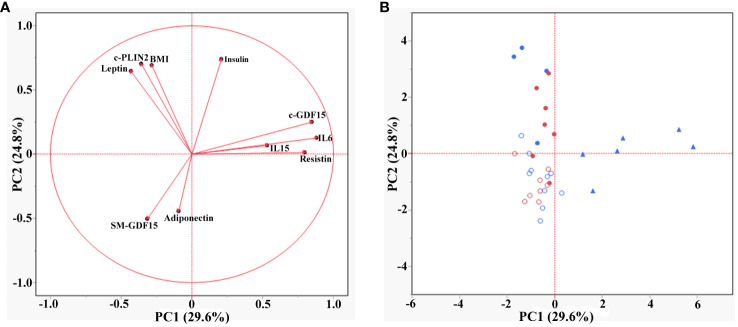
Figure 3.
Principal component analysis (PCA) in HS and LLMI. (A) Loading plot of the PCA showing the different groups of parameters. (B) Score plot of the PCA showing the association of the different groups of subjects (<40 years HS, >70 years HS, <40 years LLMI and >70 years LLMI) with the parameters analyzed. Empty red circles are HS <40 years; empty blue circles are HS >70 years; filled red circles are LLMI <40 years; filled blue circles are LLMI >70 years; filled triangles are LLMI >85 years.

