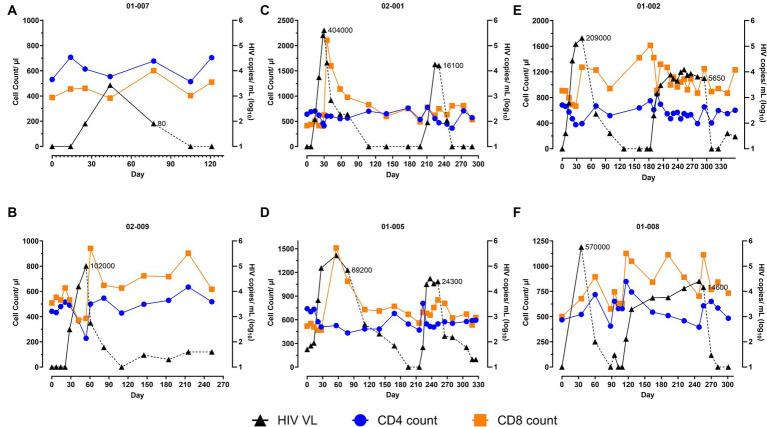
Figure 1.
Two analytical treatment interruptions (ATIs) enable viral suppression in AGT103-T treated participants. (A–F) These figures illustrate the impact of (A,B) one ATI or (C–F) two ATIs on viral rebound and immune parameters (total CD4 and CD8 T cell counts) in six participants. The participant IDs are indicated above each figure. Participants who were previously infused with AGT103-T, underwent one or two ATIs 99–490 days after the infusion. Day 0 is referred to as the first day of the ATI after ART cessation. Viral load (VL) is represented on the right-hand Y-axis and total CD4 and CD8 T cell counts are represented on the left-hand Y-axis as measured at the indicated timepoints. Participant 01-008 self-initiated his first ATI during the previous safety study. Participant 01-007 self-ceased their ART 77 days prior to their enrollment and exhibited viral control for a total of 91 days (pre-enrollment data is not shown here). The VL (HIV copies/mL) at which the participants resumed ART are indicated along the viral load curve in each graph. HIV viral copies measured in plasma are represented by black triangles (copies/mL Log10), solid black line corresponds to ATI, dashed black line corresponds to ART; blue circles represent CD4 cells (count / μL of blood); orange squares represent CD8 cell (counts/μL of blood). Loss of sample due to blood clotting or scheduling conflicts were encountered on several occasions. Samples from days 128, 176, and 218 from patient 01-002; Day 7 from patient 01-007 and Day 109 for patient 01-008 were lost due to blood coagulation or scheduling issues. Additionally, samples from days 7, 14, and 21 were not collected from 01-008 because the 1st ATI was self-initiated.

