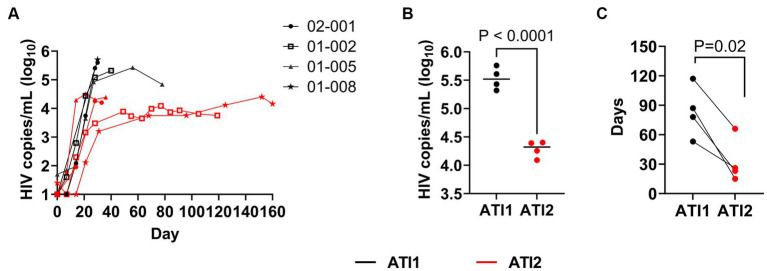
Figure 3.
Impact of multiple ATIs and AGT103-T treatment on viral suppression. (A) Viral rebound during first (black lines) and second ATI (red lines) in four patients, 01-002, 01-005, 01-008 and 02-001. Each participant’s viral load (Log10HIV copies/mL) trajectory from the two ATIs are superimposed to provide a common temporal view of the viral rebound from time (days, x-axis) of each ATI initiation. (B) Maximum peak viremia attained by each participant during the first (black) and second (red) ATI before resuming ART (p < 0.0001). The black bar in each dataset represents the median of the four peak viremia values during each ATI. (C) Comparison of number of days required by each participant to reach ≤20 copies/mL levels of viremia after the first ATI (black) and the second ATI (red) (p = 0.02). Student t-test (two-tailed) was performed to calculate the p-value.

