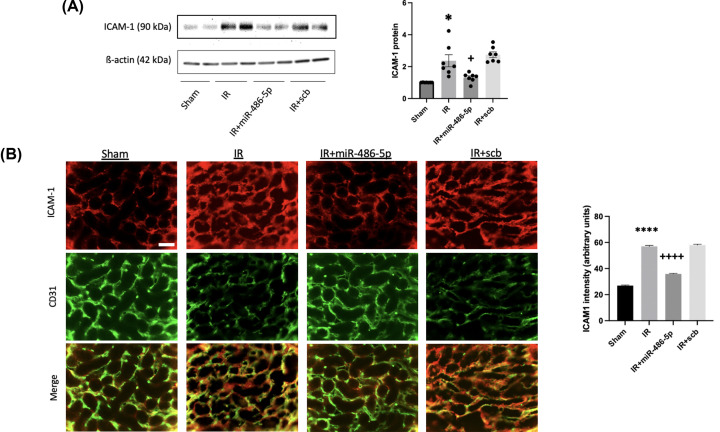
Figure 5. Effect of miR-486-5p on kidney protein levels of ICAM-1 24 h after IR injury.
(A) Graph shows kidney protein expression of ICAM-1 with representative immunoblot. Protein expression was normalized to β-actin. (B) Representative immunofluorescence images of ICAM-1 (red), CD31 (green), and co-localization (scale bar = 50 µm, magnification ×400) with semiquantative analysis for ICAM-1 signal ****P<0.0001, *P<0.05 vs sham, IR+miR-486-5p; ++++P<0.0001, +P<0.05 vs IR+scb miRNA. n = 7 rats per group.

