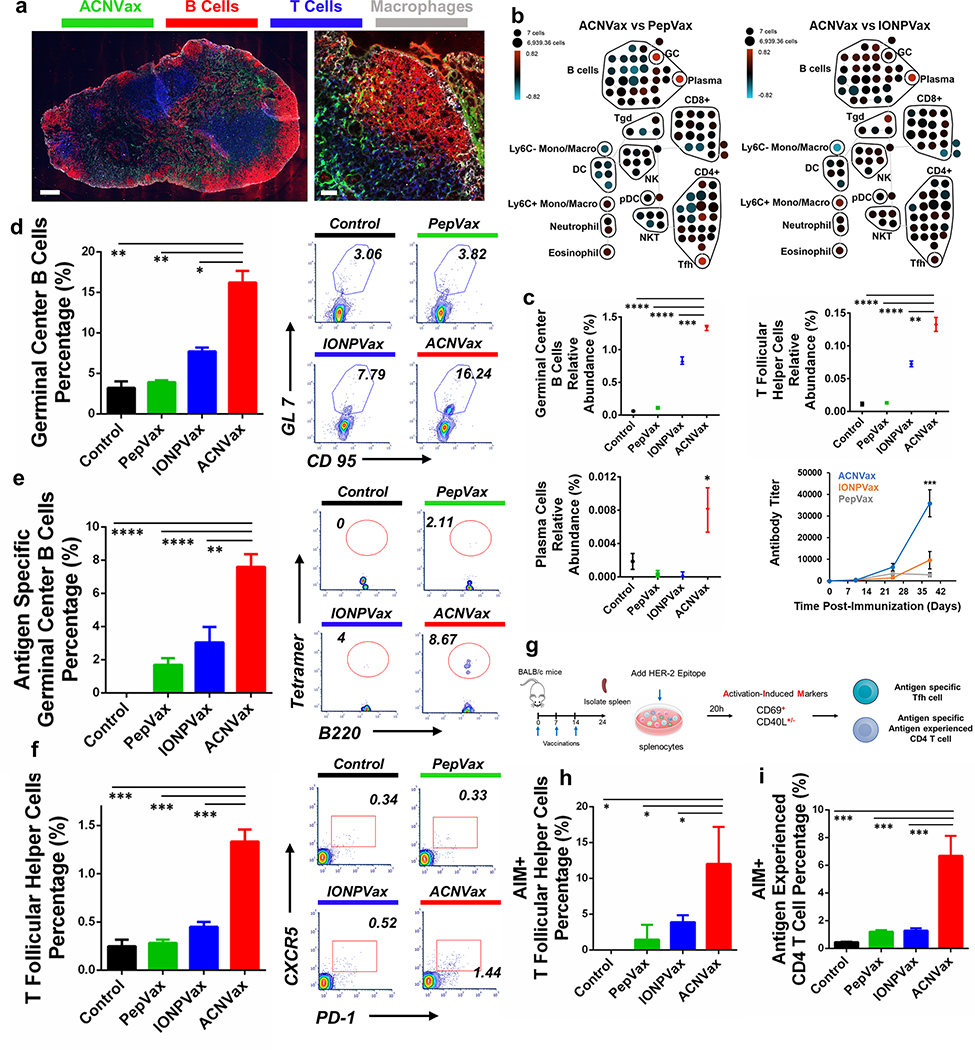
Figure 3.
ACNVax penetrated efficiently into the lymph node and induced a robust Tfh cell-supported germinal center (GC) response in vivo. (a) Confocal imaging of ACNVax penetration into lymph nodes. Scale bar is 200 μm in whole-lymph-node images and 50 μm in magnified images. (b) CyTOF analysis of immune cells from lymph nodes (n = 3). SPADE analysis. Node sizes indicate absolute number of cells. Nodes are colored based on the log ratio of the relative number of immune cells in the ACNVax group to that in the PepVax or IONPVax group in the same lymph node. Red indicates a higher relative number of immune cells in the ACNVax group, and blue indicates a lower relative number. (c) Quantification of GC B cells and Tfh cells by CyTOF. CyTOF markers for each immune cell population are shown in Figure S16. (d–f) GC B cells, antigen-specific GC B cells, and Tfh cells in the lymph nodes after three vaccinations in BALB/c mice using control (PBS), HER2-B/CD4 peptide, IONPVax, or ACNVax (14.6 nmol antigen and 13.9 nmol 2′3′-cGAMP as adjuvant) at days 0, 7, and 14 and analyzed at day 24. (d and e) Representative flow cytometry analysis and quantification of germinal center B cells (d) and HER2-specific germinal center B-cells (e) in lymph nodes using B-cell receptor tetramer staining. CD3−B220+ CD9S+ GL-7+ populations were identified as GC B cells. Data for quantification are shown as mean ± SD, n = 3. (f) Flow cytometry quantification of Tfh cells in lymph nodes. B220−CD4+CXCRS+PD-1+ populations were identified as Tfh cells. (g) Diagram of experimental design for activation-induced markers assay (AIM) for measuring antigen specific Tfh and antigen experienced CD4 T cells. (h and i) Representative flow cytometry analysis and quantification of AIM+ Tfh cells (h) and AIM+ antigen experienced CD4 T cells (i). B220−CD4+CXCRS+PD-1+ populations were identified as Tfh cells. CD69+CD40L+/− populations from Tfh cells were identified as AIM+ Tfh cells. B220−TD4+CD62L+CD69+CD40L+/− populations were identified as AIM+ antigen experienced CD4 T cells. Data for quantification are shown as mean ± SD, n = 3. Statistical comparisons were conducted between ACNVax and IONPVax, PepVax, and control groups. Statistical comparisons are based on one-way ANOVA, followed by post hoc Tukey’s pairwise comparisons or by Student’s unpaired t test. The asterisks denote statistical significance at the level of * p < 0.05, ** p < 0.01, *** p < 0.001, **** p < 0.0001. ANOVA, analysis of variance; SD, standard deviation.

