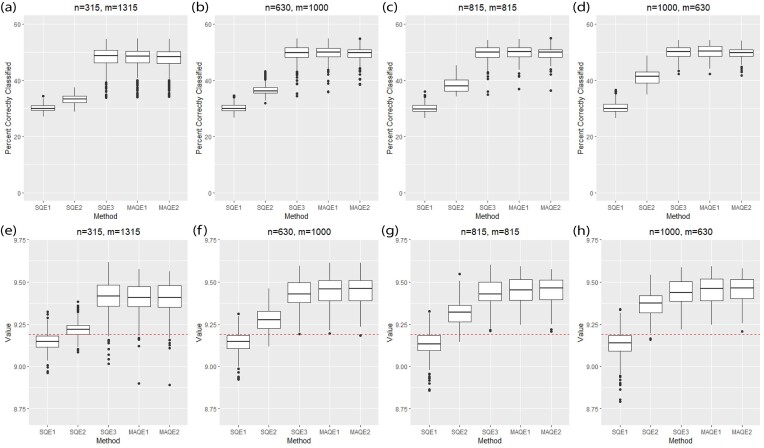
FIGURE 2.
Performance of multi-stage augmented Q-learning estimators (MAQE) and standard Q-learning estimators (SQE) with varying trial and observational study (OS) sample size ratios. The MAQE1 uses  , the MAQE2 uses
  , the SQE1 uses only OS data, the SQE2 uses combined trial and OS data, and the SQE3 uses only trial data. The red dashed line in subfigures (e)–(h) shows the value of the best one size fits all treatment, if all participants follow treatment sequence
  .
.

