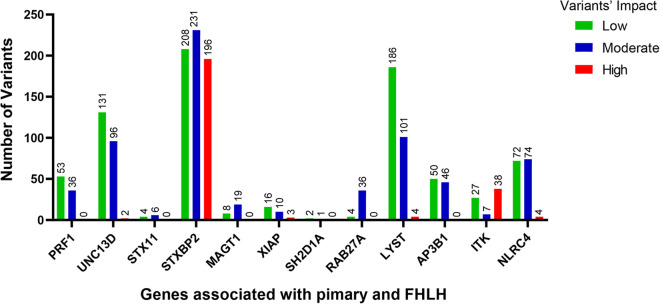
Figure 1.
The number of variants with low (green bars), moderate (blue bars) and high (red bars) impact significantly enriched in the QGP cohort vs. gnomAD database. Fisher's exact test was carried out for comparisons between QGP and gnomAD to identify variants in the 12 known primary and FHLH causative genes. Adj-p-value <0.05.

