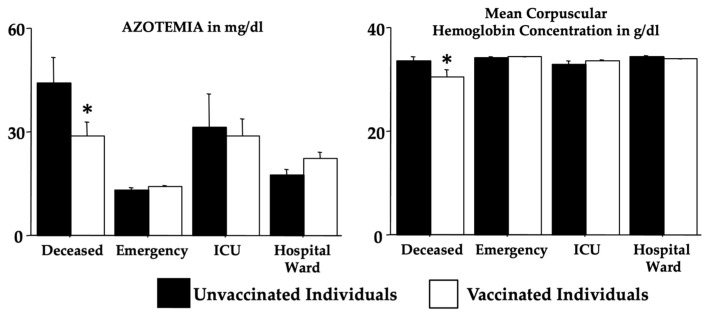
Figure 4.
Vaccination effects on azotemia and mean corpuscular hemoglobin concentration (see Table 8). The error bars indicate pooled standard error means (SEMs) derived from the appropriate error mean square in the ANOVA. The asterisk (* p < 0.05) indicates post hoc differences between vaccinated and unvaccinated individuals in the deceased group.

