Figure 1.
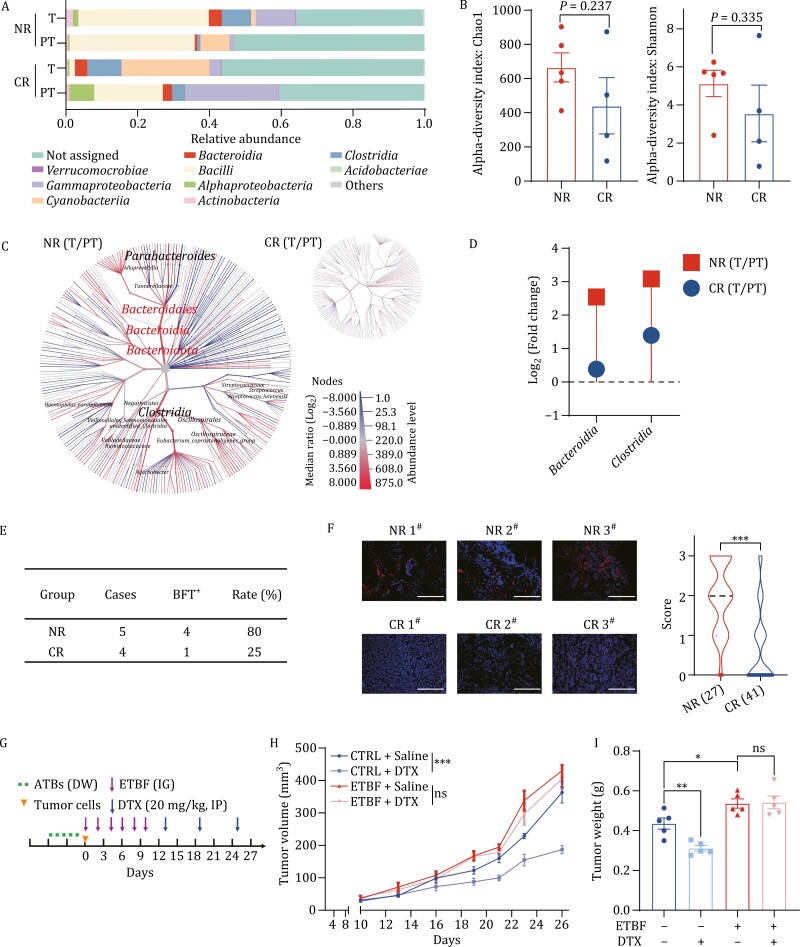
The presence of ETBF in tumors is positively associated with a poor response to chemotherapy in breast cancer patients. (A) The relative abundance of microbiota was assessed by 16S rRNA sequencing at the class level between tumors (T) and para-tumors (PT) from four complete-responders (CR) or five non-responders (NR) to Taxane-based neoadjuvant chemotherapy (TNC). Only the ten most abundant classes were shown. (B) The alpha diversity of tumor-resident microbiota between T and PT from four CR or five NR to TNC was compared by Chao1 and Shannon richness. (C) Heat tree analysis of microbiota communities at species level was assessed by using 16S metabarcoding data between T and PT from NR or CR to TNC. The intensity of the color for each taxa represented the Log2 ratio of median proportions of read. Red taxa indicated an enrichment in T and blue taxa was enriched in PT. The names were shown for only taxa with significant differences analyzed using a Wilcox rank-sum test (P-value cutoff: 0.05) followed by a Benjamini–Hochberg (FDR) correction for multiple comparison.(D) The relative abundances (fold change) of microbiota communities were assessed in T and PT from CR and NR to TNC. (E) BFT expression was detected by qRT-PCR in T from four CR or five NR to TNC, and the number and the ratio of positive cases were shown. (F) Consecutive slices were stained with fluorescence in situ hybridization (FISH) probe against ETBF 16S rRNA to examine the abundance of ETBF in tumors from NR (n = 27) and CR (n = 41). FISH score was evaluated at a scale of 0–3 based on the percentage of positively stained cells. Representative images (left) and the violin chart of FISH scores (right, mean ± standard error of mean (SEM) were shown. Scale bar: 70 μm, ***P < 0.001. (G) Schematic design for treatment regimen. Balb/c mice were treated with antibiotics (ATBs) via drinking water (DW), and infected with ETBF (1 × 10⁹ colony-forming units (CFU)) by intragastric gavage (IG) every other day for six times. Mice were injected with 3 × 10⁴ 4T1 cells at the fourth mammary fat pads of mice (n = 6 for each group). Docetaxel (DTX, 15 mg/kg) were given by intraperitoneal injection (IP) every six-day starting at day 13 (n = 6 for each group).(H) The tumor sizes were measured every two days (n = 6) and the tumor growth curve was shown. Mice were infected with ETBF (1 × 10⁹ CFU) or water (CTRL) by intragastric gavage (IG) every two days for six times in total (All values were presented as mean ± SEM, ***P < 0.001, vs. CTRL). (I) The tumor weights of 4T1 allograft at the end of experiments were analyzed and graphed. The bar graph was presented as mean ± SEM, *P < 0.05, **P < 0.01, ns: no significance.

