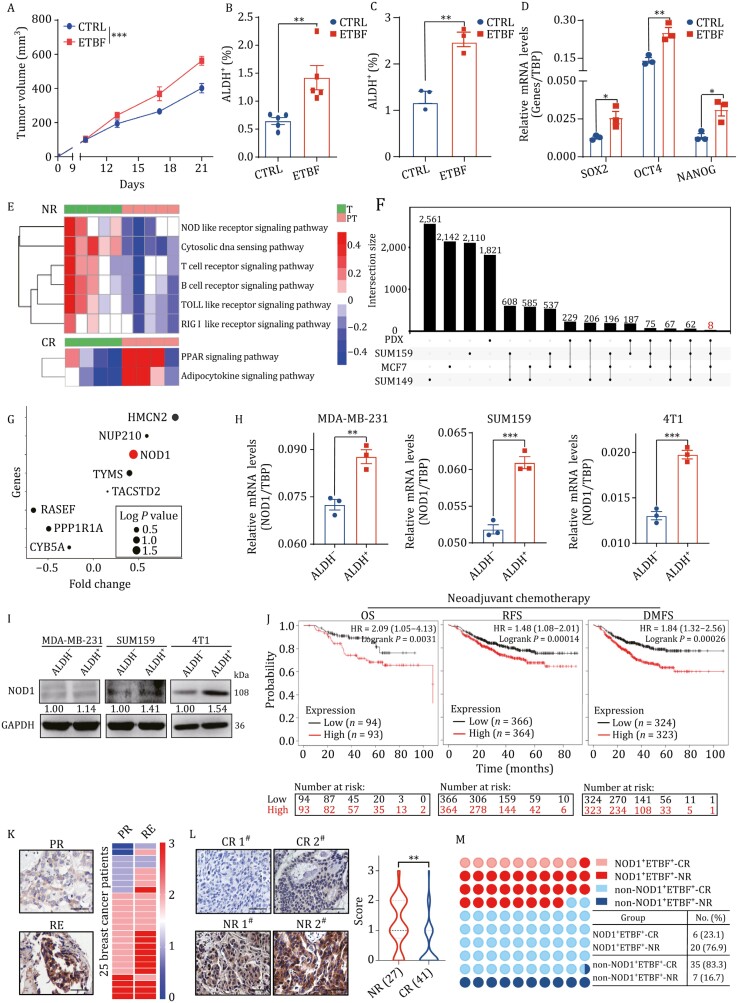
Figure 2.
ETBF presence and NOD1 expression together in breast tumors predict a poor response to chemotherapy. (A) The sizes of 4T1 cell allograft tumors treated with or without ETBF were measured every four days in Balb/c mice and the tumor growth curve was shown. Mice were infected with ETBF (1 × 10⁹ CFU) or water (CTRL) by intragastric gavage (IG) every two days for six times in total (All values were presented as mean ± SEM, ***P < 0.001, vs. CTRL). (B) The percentage of ALDH+ cells was detected by ALDEFLUOR assay in tumor cells from 4T1 cell allograft tumors treated with or without ETBF. The bar graph was presented as mean ± SEM, **P < 0.01. (C) The percentage of ALDH+ cells was detected by ALDEFLUOR assay in SUM159 cells treated with or without ETBF. The bar graph was presented as mean ± SEM of three biological independent experiments, **P < 0.01. (D) The mRNA was isolated from SUM159 cells treated with or without ETBF. The mRNA expression levels of stemness genes SOX2, OCT4 and NANOG were detected by qRT-PCR. The bar graph was presented as mean ± SEM, *P < 0.05, **P < 0.01. (E) Pathway enrichment signatures were assessed by gene set enrichment analysis (GSEA) in T compared to PT from NR and CR to TNC. The rows corresponded to canonical pathways from the Reactome Pathway Database and the columns corresponded to tissue samples. The blue or red color of each cell referred to the − log10 (P-value). (F) The overlapped stemness-relative genes were analyzed in ALDH+ cancer stem cells compared to ALDH- cancer cells from three breast cancer cell lines (SUM159, MCF7, and SUM149) and two breast cancer PDX (overlap gene list) models. Totally, eight overlapped genes were detected in all three cell lines and two PDX models. (G) A bubble chart showed the logP value and fold change (FC) at mRNA expression level of above overlapped stemness-relative genes in T from CR compared to T from NR as in (E). (H) The mRNA expression of NOD1 in both ALDH+ and ALDH− cells sorted from MDA-MB-231, SUM159 and 4T1 cells was analyzed by qRT-PCR. The bar graph was presented as mean ± SEM of three biological independent experiments, **P < 0.01, ***P < 0.001.(I) NOD1 protein level in both ALDH+ and ALDH− cells sorted from MDA-MB-231, SUM159 and 4T1 cells was analyzed by Western blot. (J) The probability of overall survival (OS), relapse free survival (RFS), and distant metastasis-free survival (DMFS) of breast cancer patients received neoadjuvant chemotherapy was analyzed according to NOD1 mRNA expression and the statistical significance was analyzed by log-rank test. Patients were divided into a high-risk group and a low-risk group according to the median value of the NOD1 mRNA expression in tumor tissues. The numbers in the bottom part of the figure are “number at risk”. (K) NOD1 expression was analyzed by IHC staining in paired primary tumors (PR) and recurrent tumors (RE) from the same breast cancer patients. The representative IHC staining images of NOD1 were shown (left, Scale bar: 50 μm). The heatmap (right) showed the IHC staining intensity scores of NOD1 in PR and RE from 25 breast cancer patients. (L) NOD1 expression was analyzed by immunohistochemistry (IHC) staining in breast tumor tissues. The representative IHC staining images of NOD1 were shown (left, Scale bar: 50 μm). Violin plot (right) was shown for the comparison of IHC staining intensity scores of NOD1 between NR (n = 27) and CR (n = 41) to TNC. The bar graph was presented as mean ± SEM, *P < 0.05.(M) The correlation between NOD1 expression and ETBF presence in tumor tissues from NR or CR to TNC was assessed by IHC staining for NOD1 and FISH staining for ETBF 16S rRNA.

