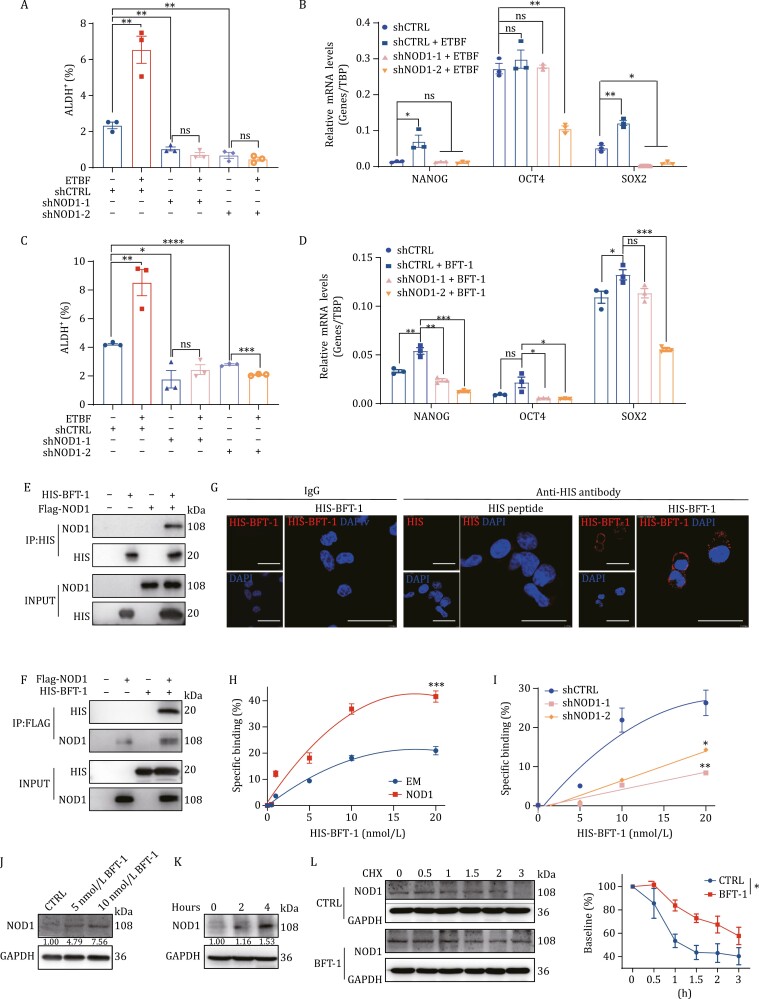
Figure 3.
NOD1 is a functional receptor for BFT-1 and mediates ETBF-enhanced cancer cell stemness. (A) The percentage of ALDH+ cells was detected by ALDEFLUOR assay in the control (shCTRL) or NOD1-knockdown (shNOD1-1, shNOD1-2) SUM159 cells treated with or without ETBF. The bar graph was presented as mean ± SEM of three biological independent experiments, **P < 0.01. (B) The mRNA was isolated from shCTRL or NOD1-knockdown (shNOD1-1, shNOD1-2) SUM159 cells treated with or without ETBF. The mRNA expression levels of stemness genes SOX2, OCT4, and NANOG were detected by qRT-PCR. The bar graph was presented as mean ± SEM, *P < 0.05, **P < 0.01, ns: no significance. (C) The percentage of ALDH+ cells was detected by ALDEFLUOR assay in the control (shCTRL) or NOD1-knockdown (shNOD1-1, shNOD1-2) SUM159 cells treated with or without BFT-1. The bar graph was presented as mean ± SEM of three biological independent experiments, *P < 0.05, **P < 0.01, ****P < 0.0001, ns: no significance.(D) The mRNA was isolated from shCTRL or NOD1-knockdown (shNOD1-1, shNOD1-2) SUM159 cells treated with or without BFT-1. The mRNA expression levels of stemness genes SOX2, OCT4, and NANOG were detected by qRT-PCR. The bar graph was presented as mean ± SEM, *P < 0.05, **P < 0.01, ***P < 0.001, ns: no significance. (E and F) The direct interaction between BFT-1 and NOD1 was assessed by GST pull-down assay. (G) The confocal microscopic images were shown for NOD1-overexpressing SUM159 cells. NOD1-overexpressing SUM159 cells were treated with HIS-peptide or HIS-tagged BFT-1 for two h and stained with anti-HIS antibody. An isotype-matched IgG was used as a control. Cell nuclei were counterstained with DAPI. Scale bar, 20 μm. (H) The empty vector (EM) or NOD1-overexpressing (NOD1) 4T1 cells were treated with or without graded concentrations (0–20 nmol/L) of HIS-tagged BFT-1 for 30 min, and the cells were stained with anti-HIS antibody and the HIS-tagged BFT-1 binding properties were analyzed by flow cytometry. Dead cells were excluded prior to analysis with DAPI staining. All values were presented as mean ± SEM, ***P < 0.001.(I) The shCTRL or NOD1-knockdown (shNOD1-1, shNOD1-2) MDA-MB-231 cells were treated with or without graded concentrations (0–20 nmol/L) of HIS-tagged BFT-1 for 30 min, and the cells were stained with anti-HIS antibody and the HIS-tagged BFT-1 binding properties were analyzed by flow cytometry. Dead cells were excluded prior to analysis with DAPI staining. All values were presented as mean ± SEM, *P < 0.05, **P < 0.01.(J) The protein level of NOD1 in MDA-MB-231 cells treated with BFT-1 at indicated concentrations was analyzed by Western blot. (K) The protein level of NOD1 in MDA-MB-231cells treated with 10 nmol/L BFT-1 for 2 or 4 h was analyzed by Western blot.(L) MDA-MB-231 cells were pretreated with or without 10 nmol/L BFT-1 for 4 h. The culture medium was then replaced with medium containing CHX, and the cells were harvested at the indicated times after CHX treatment. The protein level of was analyzed by Western blot (left) and the NOD1 density was quantified by densitometry using image J (right). Cycloheximide (CHX): 10 μmol/L. All values were presented as mean ± SEM, **P < 0.01, ns: no significance.

