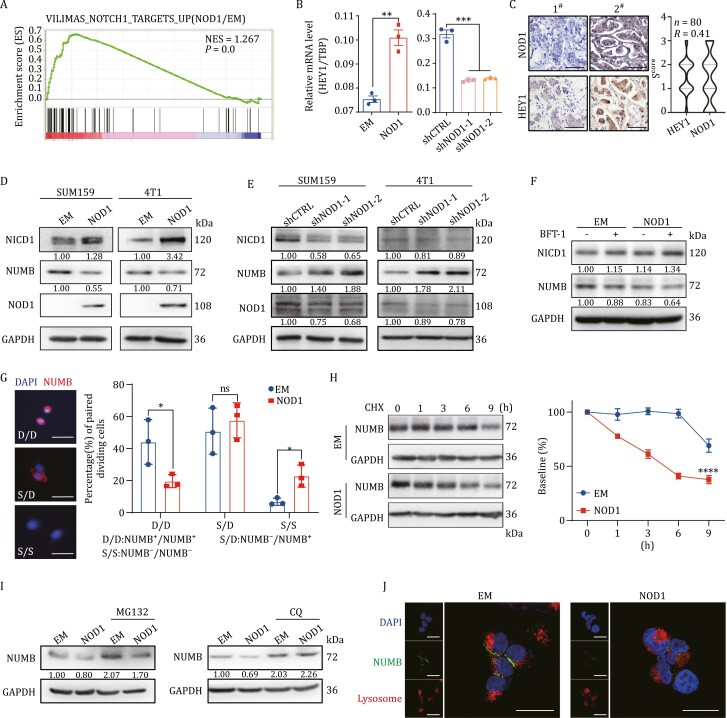
Figure 5.
NOD1 promotes NUMB lysosomal degradation and subsequently activates the NOTCH1-HEY1 pathway. (A) Pathway enrichment signatures were assessed by gene set enrichment analysis (GSEA) in EM and NOD1-overexpressing breast cancer cells. The normalized enrichment score (NES) and P value were shown in the pictures. (B) The mRNA was isolated from EM or NOD1-overexpressing and shCTRL or NOD1-knockdown (shNOD1-1, shNOD1-2) SUM159 cells. The mRNA expression levels of HEY1 were detected by qRT-PCR. The bar graph was presented as mean ± SEM of three biological independent experiments, **P < 0.01, ***P < 0.001. (C) The correlation between NOD1 expression and HEY1 expression was analyzed in breast tumor tissues by IHC scores using Pearson’s correlation analysis. Representative IHC images of NOD1 and HEY1 in tumor tissues from the same patient (left, scale bar, 100 μm) and violin plot of IHC score of NOD1 or HEY1 (right) were shown (n = 80). (D) The protein level of NICD1 and NUMB in EM or NOD1-overexpressing SUM159 or 4T1 cells was analyzed by Western blot. (E) The protein level of NICD1 and NUMB in shCTRL or NOD1-knockdown (shNOD1-1, shNOD1-2) SUM159 or 4T1 cells was analyzed by Western blot. (F) The protein level of NICD1 and NUMB in EM or NOD1-overexpressing SUM159 cells treated with or without 10 nmol/L BFT-1 was analyzed by Western blot. (G) NUMB in two daughter cells was detected by immunofluorescence (IF) staining with NUMB antibody in ALDH+ cells sorted from EM or NOD1-overexpressing SUM159 cells. Bar chart showed the frequency of NUMB−/NUMB+ (S/D), NUMB+/NUMB+ (D/D), or NUMB−/NUMB− (S/S) cell pairs. The bar graph was presented as mean ± SEM of three biological independent experiments (n = 50 ALDH+ cells/replicate), *P < 0.05, ns: no significance. (H) The degradation rate of NUMB was analyzed by Western blot in EM or NOD1-overexpressing SUM159 cells. The protein level of was analyzed by Western blot (left) and the NUMB density was quantified by densitometry using image J (right). Cycloheximide (CHX): 10 μmol/L. All values were presented as mean ± SEM, ****P < 0.0001. (I) NUMB protein level was analyzed by Western blot in EM or NOD1-overexpressing SUM159 cells treated with or without the lysosomal inhibitor chloroquine (CQ, 1 μmol/L) or the proteasome inhibitor MG132 (1 μmol/L) for 9 h. (J) The localization of NUMB (green) and the lysosomal tracker (red) was analyzed by IF staining in EM or NOD1-overexpressing HEK293T cells treated with CQ for 9 h. Scale bar, 20 μm.

