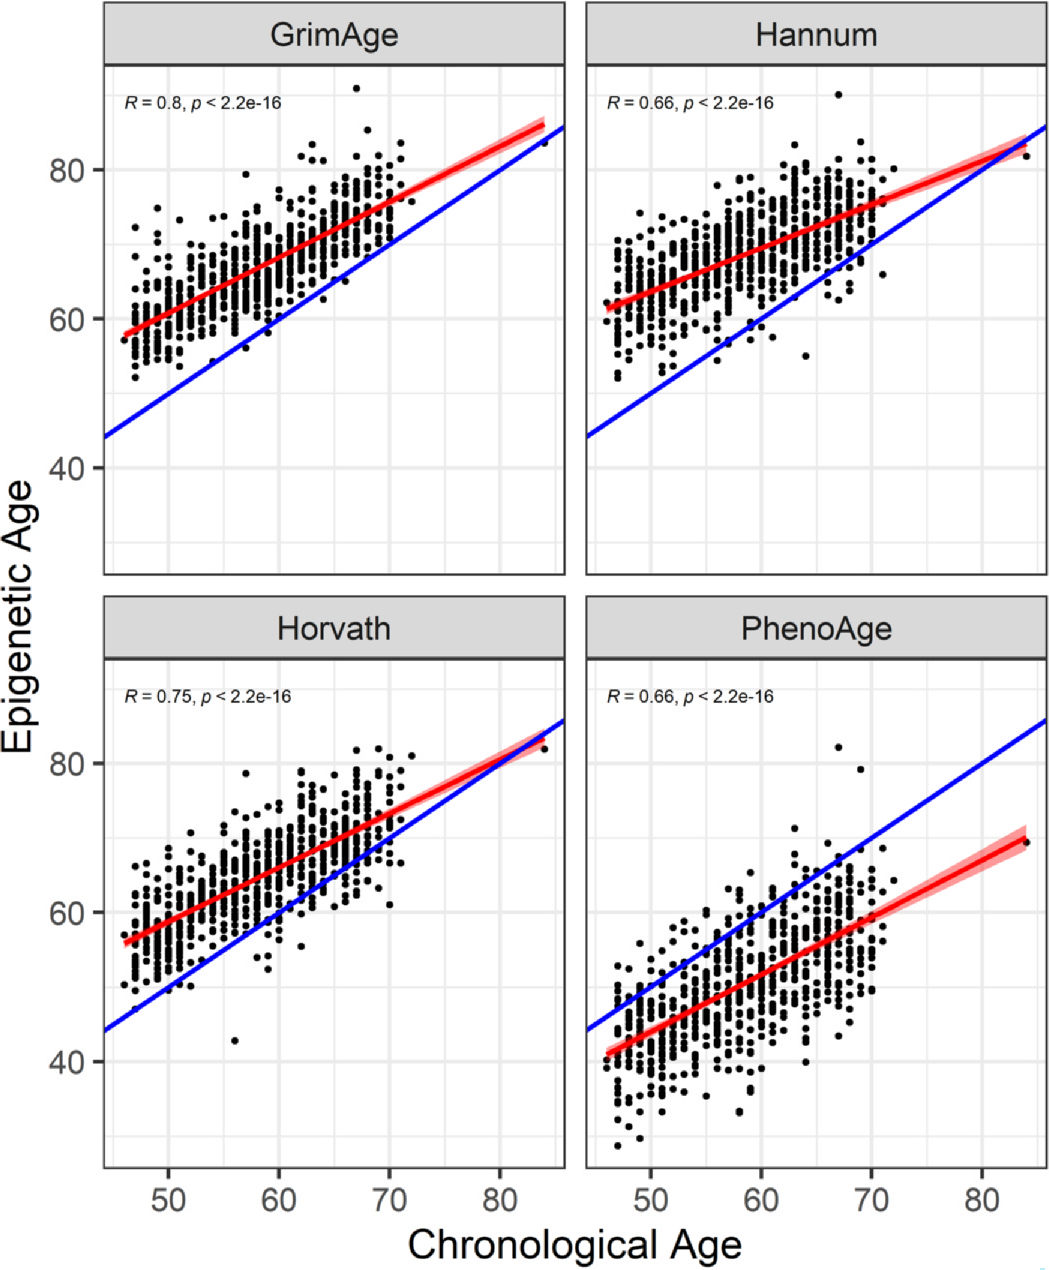
Fig. 1.

Pearson’s correlation between epigenetic age and chronological age. Scatterplots represent epigenetic age (GrimAge, Hannum, Horvath, PhenoAge) in years on the y axis and chronological age in years on the x axis along with their respective Pearson correlation coefficients and p-values. Red lines represent the best fit line and blue lines represent epigenetic age = chronological age.
