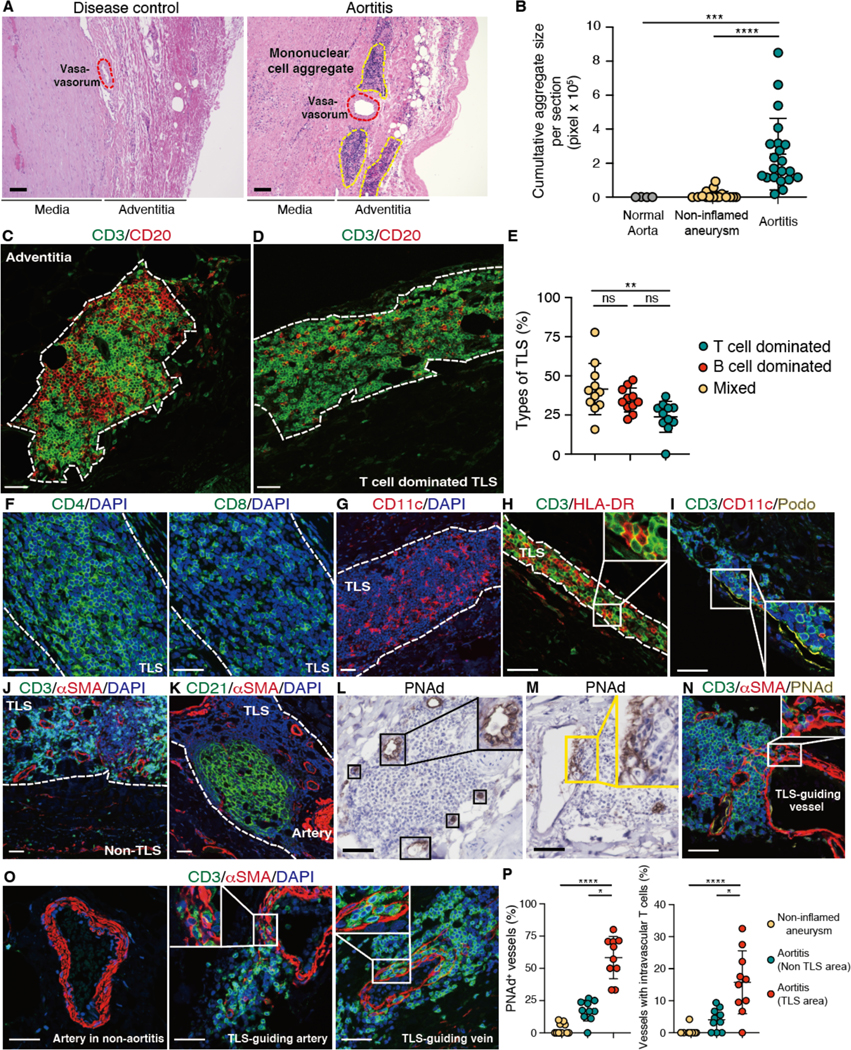
Fig. 1. TLS are formed in large vessel vasculitis.

Tissue samples were collected from the ascending aorta of patients with GCA and patients with non-inflammatory aneurysm (disease control). Tissue sections were analyzed by multi-color immunofluorescence (IF); nuclei were stained with DAPI. (A) In GCA aortitis, mononuclear cells formed organized lymphoid aggregates around adventitial blood vessels. Tissues were stained with hematoxylin and eosin. (B) Cumulative size of mononuclear cell aggregates per tissue section (aortitis: n=22, disease control: n=20, normal aorta: n=4). Each dot represents one tissue. (C and D) Tissues were stained for CD3 and CD20; representative images of a mixed TLS (C) and a T cell dominated TLS (D) are shown. (E) Depending on the dominant cell type, TLS were categorized as T cell dominated, B cell dominated or mixed. Proportions are shown for 11 cases of aortitis. (F to K) Tissues were stained for CD4 and CD8 (F); CD11c (G); CD3 and HLA-DR (H); CD3, CD11c, and Podoplanin (Podo) (I); CD3 and αSMA (J); or CD21 and αSMA (K). (L and M) Peripheral lymph node addressin (PNAd) expression was examined by immunohistochemistry. PNAd+ high endothelial cells are shown in (L). Subendothelial immune cell pockets are indicated in (M). (N and O) Tissue were stained for CD3, αSMA and PNAd (N) and for CD3 and αSMA (O). (P) Frequencies of PNAd+ vessels and vessels with intravascular T cells in aortitis and in non-inflamed aneurysms (n=10) are compared. TLS and T cell zones are marked by dotted lines. Data are presented as mean ± SD with individual values indicated. Data were analyzed by Kruskal-Wallis test with post-hoc (B and P), one-way ANOVA with Tukey post hoc test (E). *P < 0.05, **P < 0.01, ***P < 0.001, ****P < 0.0001. Scale bars, 100 μm (A) or 50 μm (C and D, F to O).
