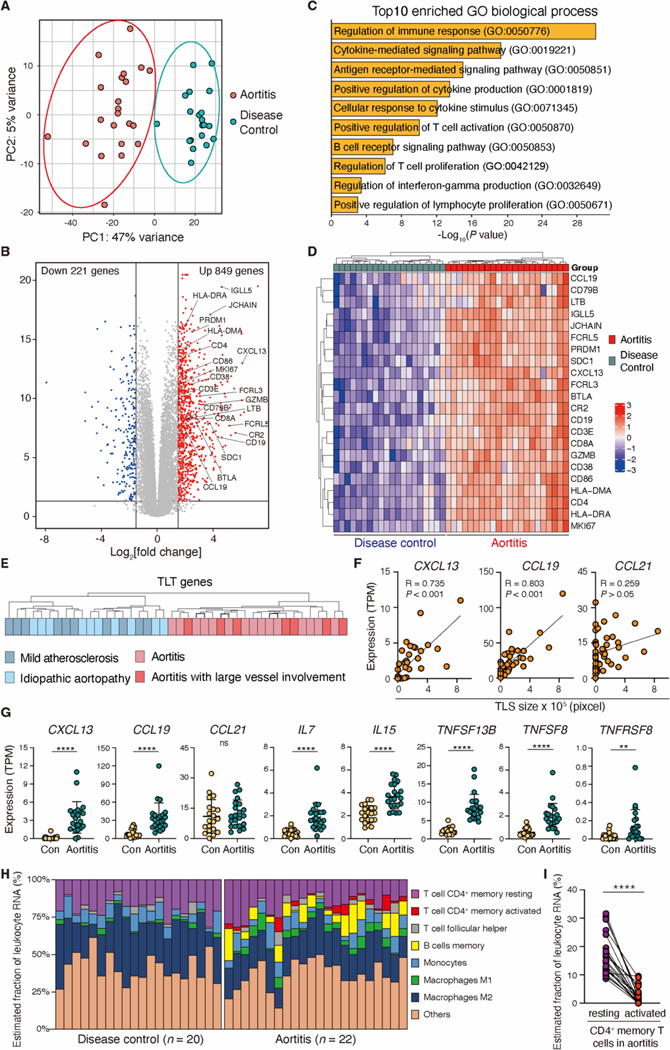
Fig. 2. Inflamed aortic wall expresses a TLS transcriptomic signature.
Human ascending aortic tissues from patients with giant cell aortitis (n=22) or non-inflamed aortic aneurysms (n=20 disease controls) were analyzed by bulk RNA-seq. (A and B) A principal component analysis (PCA) (A) and a volcano plot showing DEGs between aortitis and non-inflamed aneurysms (B) are presented. (C) Shown are the top 10 enriched pathways in GCA aortitis. Statistical significance was determined by enrichr (48). (D) The hierarchical clustering heatmap indicates 22 transcripts relevant in TLS formation (TLS gene signature) in aortitis and non-inflamed aneurysms. (E) Subgroup analysis comparing the TLS gene signature in the indicated clinical subtypes. (F) TLS size (Fig. 1C) and TPM values of CXCL13, CCL19 and CCL21 (n=22 aortitis cases, n=20 disease controls) are correlated. (G) Shown are comparisons of TPM values of TLS-related genes (CXCL13, CCL19, CCL21, IL-7, IL15, TNFSF13B, TNFSF8 and TNFRSF8) in aortitis and disease controls. (H) CIBERSORT analysis of RNA-seq data is used for a quantitative evaluation of immune cell infiltrates in aortitis (n=22) and disease controls (n=20). (I) Estimated proportions of resting and activated CD4+ memory T cells in aortitis are shown. Data are presented as mean ± SD. Data were analyzed by Mann-Whitney U test (G, I). Correlations were determined by Pearson’s correlation analysis (F). **P < 0.01, ****P < 0.0001; ns, not significant.

