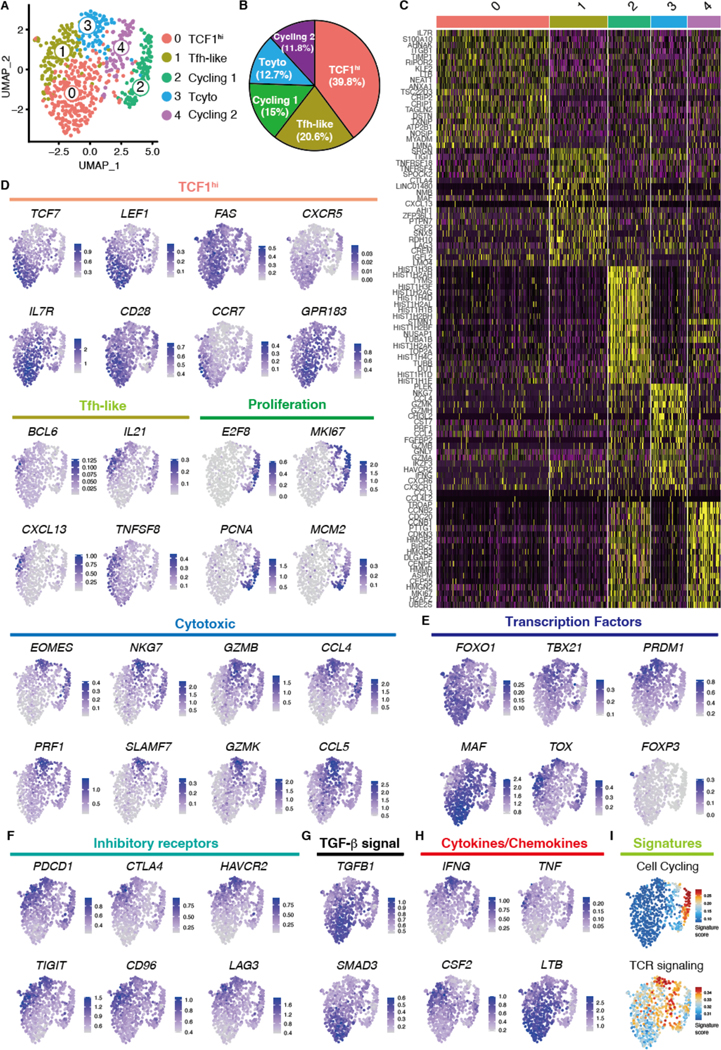
Fig. 3. Single cell RNA sequencing defines multiple subsets of vasculitogenic CD4+ T cells.

Vasculitis was induced in human arteries engrafted into NSG mice by adoptively transferring PBMCs from patients with GCA. CD4+ T cells were isolated from digested inflamed arteries and analyzed by scRNA-seq. (A) Uniform manifold approximation and projection (UMAP) representation of the CD4+ T cell dataset of 680 cells from the inflamed arteries (n=3); each dot represents a single T cell, and cells are colored as 1 of 5 discrete subsets. (B) A circle graph of the relative frequencies of each CD4+ T cell subset is shown. (C) Shown is a heatmap of the top 20 differentially expressed genes driving heterogeneity of vessel wall infiltrating CD4+ T cells. (D to H) UMAP visualizations of gene expression in CD4+ T cells are shown; Cluster defining signature genes (D), key transcriptional factors (E), inhibitory receptors (F), genes involved in TGF-β signaling (G), and cytokines and chemokines (H) are presented. (I) UMAP presentation shows cell cycling and TCR signaling gene signature scores for individual CD4+ T cells.
