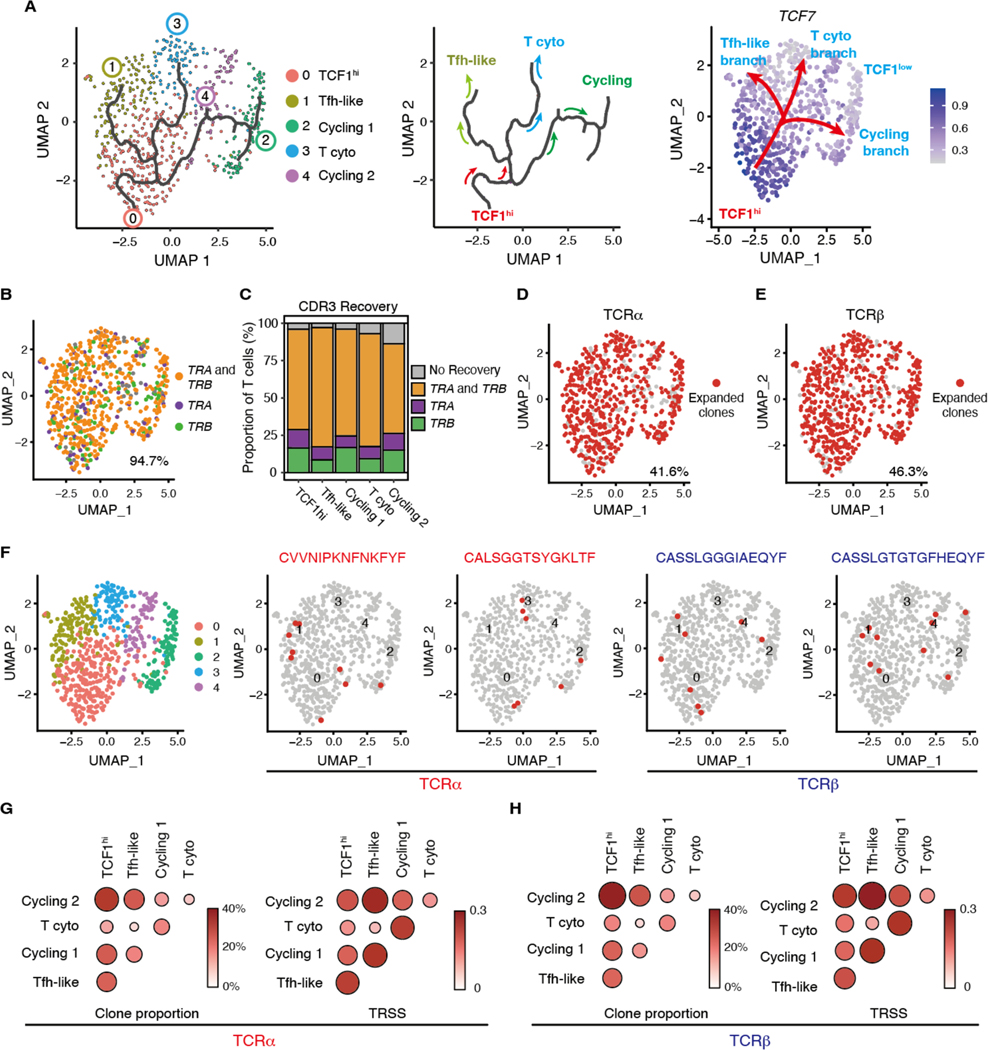
Fig. 4. Different vasculitogenic CD4+ T cell subpopulations share TCR clones.
Cluster assignment of scRNA-seq was performed as in Fig. 3. (A) Single-cell trajectories of vasculitogenic CD4+ T cells were generated with Monocle3 pseudotime analysis. CD4+ T cells are colored by clusters and the black line traces the trajectory (left panel). The pseudotime trajectory marks three branch nodes; the split of cycling and differentiating CD4+ T cells, which then both separate into two subsets (middle panel). In the right panel, the root of the trajectory is represented by TCF1hi CD4+ T cells, which transition into three TCF1lo branches: cycling CD4+ T cells, cytotoxic (cyto) CD4+ T cells, and Tfh-like T cells. (B to G) Tissue-derived CD4+ T cells were analyzed by single cell T cell receptor sequencing (scTCR-seq). (B) Recovered CDR3 sequences for TRA and TRB are projected on the same UMAP as the scRNA-seq data. (C) Proportions of successful CDR3 recovery for TRA and TRB are shown for each T cell subset. (D and E) Expanded TCRα (D) and TCRβ (E) clonotypes (clonotype frequency > 1 cell) are shown. (F) Shown are examples of expanded clonotypes that share TCRα or TCRβ across distinct T cell subsets. (G and H) Proportion of clonal overlap and TCR repertoire similarity score (TRSS) amongst tissue-infiltrating CD4+ T cell subpopulations for TCRα (G) and TCRβ (H).

