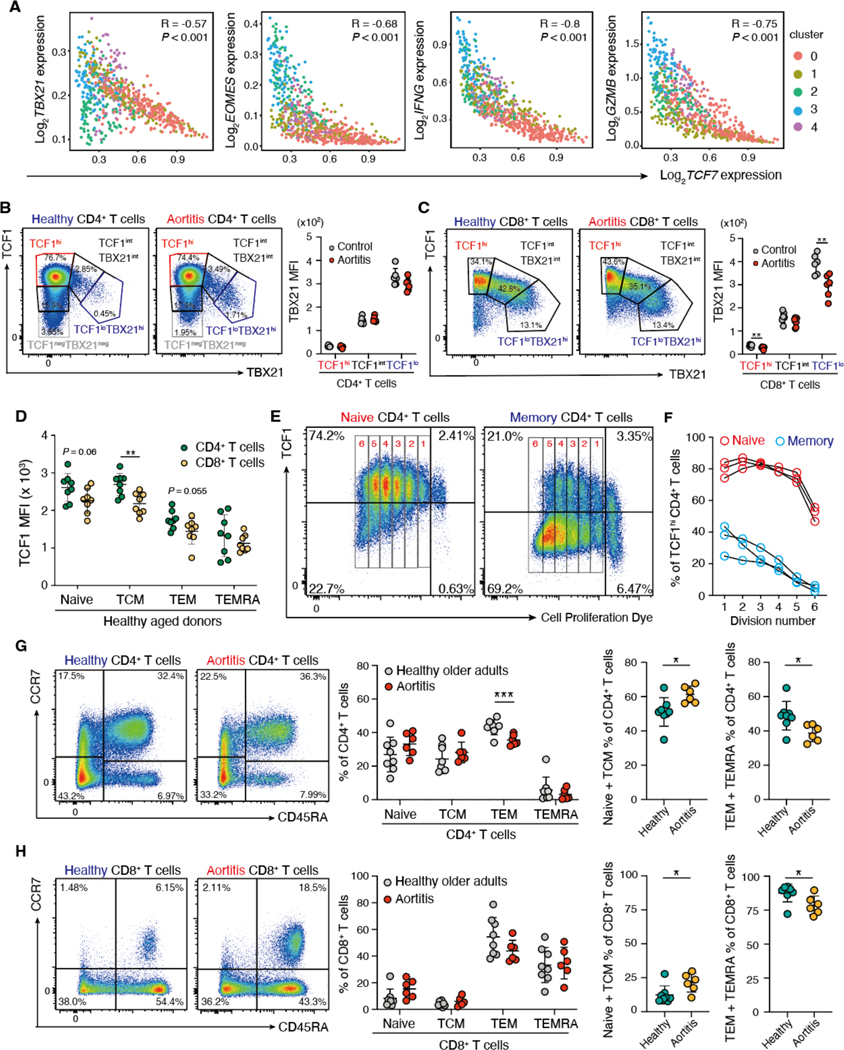
Fig. 5. TCF1 expression correlates with the T cell differentiation state.
(A) Gene expression of TCF7 was correlated with the transcription factors TBX21 and EOMES and the effector molecules IFNG and GZMB in scRNA-seq data of individual CD4+ T cells isolated from vasculitic lesions. Color coding reflects the cluster assignment in Fig. 3A. (B to H) PBMCs were collected from patients with GCA aortitis and age-matched controls and analyzed by flow cytometry. (B and C) Expression of the transcription factors TCF1 and TBX21 (also known as T-bet) in CD4+ (B) and CD8+ T cells (C) (n=6 each) is shown. Representative dot plots and quantification of TBX21 mean fluorescence intensities (MFI) in TCF1hi, TCF1int and TCF1lo T cells are presented. (D) TCF1 expression was quantified in healthy CD4+ and CD8+ T cells isolated from healthy older adults subdivided into naïve, central memory (TCM), effector memory (TEM) and terminally differentiated effector memory CD45RA+ T cells (TEMRA) (n=8 each). (E and F) Naïve (E) and memory (F) CD4+ T cells were isolated, labeled with CellTrace and stimulated in vitro. TCF1 expression was measured 6 days after stimulation by flow cytometry. Representative dot plots and data from three donors are shown. (G and H) CD4+ (G) and CD8+ (H) T cells from patients with GCA aortitis (n=6) and age-matched controls (n=8) were subdivided into naïve, TCM, TEM, and TEMRA. Representative dot plots, frequencies of the T cell subsets and combined proportions of (naïve plus TCM) and (TEM plus TEMRA) are shown. Data are presented as mean ± SD with individual values indicated. Data were analyzed by unpaired two-tailed t-test (B to D, G and H). *P < 0.05, **P < 0.01, ***P < 0.001, ****P < 0.0001.

