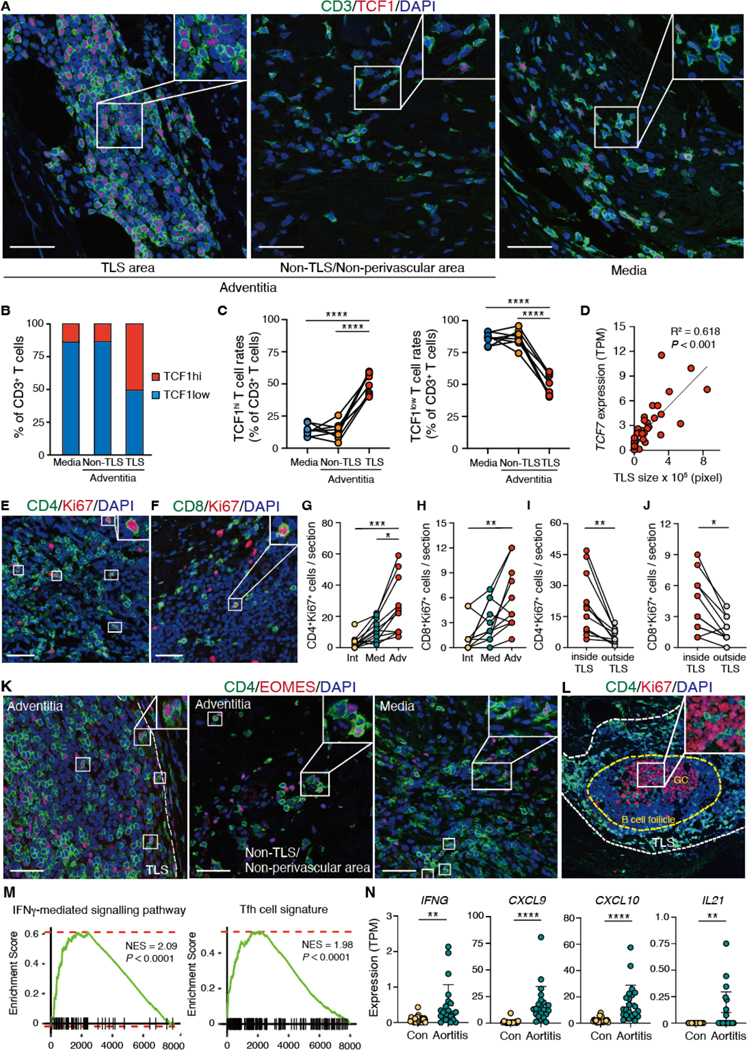
Fig. 6. TCF1hi CD4+ T cells preferentially localize to TLS.

(A) Spatial mapping of TCF1hi T cells in GCA aortitis was visualized by IF staining. Tissues were subdivided into three territories: inside of adventitial TLS, outside of adventitial TLS and medial layer. (B) Proportions of TCF1hi and TCF1lo T cells in the media, inside the TLS, and in non-TLS territory were determined (n=8). (C) Shown is the geographical distribution of TCF1hi and TCF1lo T cells in individual cases of GCA aortitis. Frequencies of TCF1hi and TCF1lo T cells were measured in the medial layer, inside of adventitial TLS, and in the surroundings of the TLS. (D) Shown is the correlation between TCF7 TPM values and TLS sizes in 22 cases of GCA aortitis and 20 cases of disease controls. (E and F) Proliferating CD4+ (E) and CD8+ (F) T cells were mapped. Cycling T cells were detected by Ki67 expression. (G and H) Shown is the geographical distribution of CD4+Ki67+ (G) and CD8+Ki67+ (H) T cells in the intima, the media, and the adventitia of 11 cases of GCA aortitis. (I and J) Shown is the placement of CD4+Ki67+ (I) and CD8+Ki67+ (J) T cells inside or outside of TLS (n=11). (K) CD4 and EOMES expression was analyzed by dual-color IF in different tissue niches: inside TLS, surroundings of TLS, or media. (L) CD4 and Ki67 expression was examined by dual color IF. CD4+ T cells are detected inside of germinal centers (proliferating cell cluster). (M) Shown are GSEAs for the IFN-γ-mediated signaling pathway and for the Tfh cell signature in aortitis (n=22) and in non-inflamed aneurysms (n=20). (N) TPM values for IFNG, CXCL9, CXCL10 and IL21 in aortitis (n=22) and in non-inflamed aneurysms (Con; n=20) are compared. Data are presented as mean ± SD with individual values shown. Data were analyzed by one-way ANOVA with Tukey post hoc test (C, G), Kruskal-Wallis test with post-hoc (H) or Mann-Whitney U test (I, J, N). The correlation in (D) was determined by Pearson’s correlation analysis. *P < 0.05, **P < 0.01, ***P < 0.001, ****P < 0.0001. Scale bars, 50 μm.
