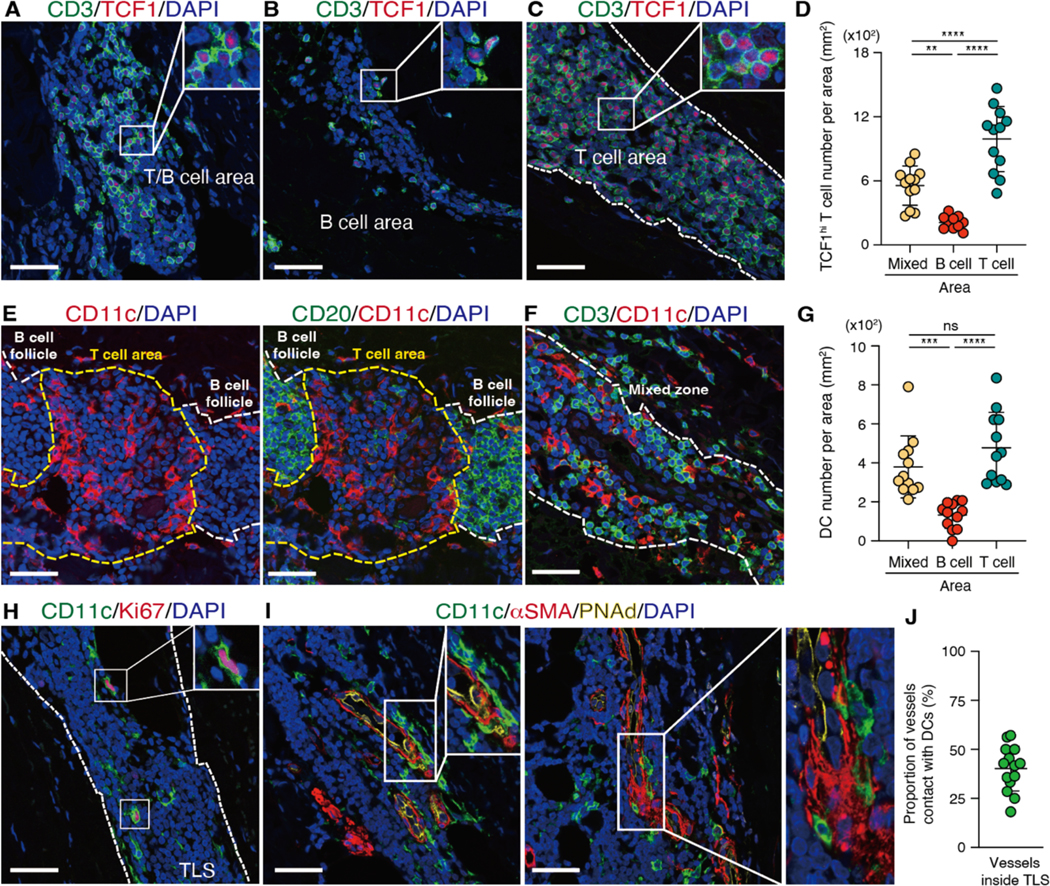
Fig. 7. TCF1hi T cells survive in defined cellular neighborhoods.

TLS were identified in the aortic wall of GCA-affected tissues and each TLS was subdivided into three zones: T cell zone, B cell zone, and mixed zone. Multi-color IF was used for spatial mapping of all cell types. (A to C) Mapping of the T/B cell area (A), the B cell area (B), and the T cell area (C) as well as quantification of TCF1hi T cells in different zones (n=12) (D) are shown. (E to F) Tissue distribution of CD11c+ dendritic cells (DC) in the T and B cell zone (E) and in the mixed zone (F) are shown and CD11c+ DC numbers in different zones (G) are compared. (H) Proliferating CD11c+ DCs were identified by Ki67 staining. (I) DC-microvessel contact sites are visualized. Microvessels were identified through αSMA and PNAd. (J) Proportions of αSMA+ microvessels inside TLS in direct contact to DC were quantified (n=14). Localization of TLS and T cell zones is indicated by dotted lines. Data are presented as mean ± SD with individual values indicated. Data were analyzed by one-way ANOVA with Tukey post hoc test (D, G). **P < 0.01, ***P < 0.001, ****P < 0.0001. Scale bars, 50 μm.
