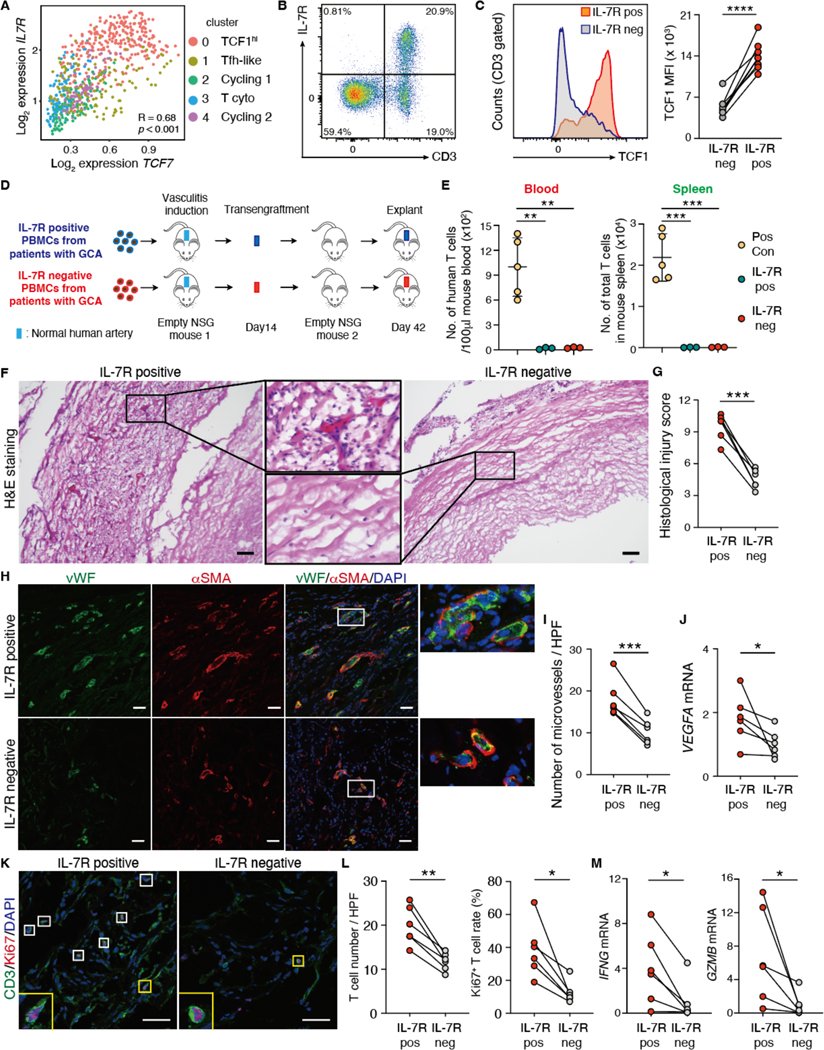
Fig. 8. TCF1hiCD4+ T cells function as disease stem cells.
(A) TCF7 and IL-7R gene expression in individual CD4+ T cells isolated from vasculitic lesions are correlated. (B) Representative flow cytometry plot is shown for CD3 and IL-7R in PBMCs from older adults. (C) TCF1 expression in IL-7R positive (IL-7R+) and IL-7R negative (IL-7R−) T cells are compared. Representative histogram and data from 8 individuals are presented. (D) Shown is a scheme of the serial transplantation experiments. Pairs of NSG mice were engrafted with human arteries, reconstituted with IL-7R+ or IL-7R− PBMCs from patients with GCA. IL-7R− PBMCs were prepared by depleting IL-7R+ cells. Vasculitis was induced in engrafted human arteries and inflamed arteries were transplanted into “empty” NSG mice. Finally, arteries were explanted on day 42. (E) Numbers (No.) of human T cells in the blood (100μl) and the spleen of NSG mice reconstituted with IL-7R+ or IL-7R− PBMCs were quantified (n=3). Data of T cell numbers in 100μl blood and spleen 7 days after vasculitis induction were used as positive control (49). (F to M) Tissue sections were prepared from the explanted arteries and the intensity of vasculitis was assessed in arteries. (F) Representative images (H&E) show density of intrawall infiltrates. (G) Shown is a comparison of vascular injury scores in arteries (n=6 each). (H and I) Intralesional microvessels were identified by dual color IF analysis of vWF (green) and αSMA (red). Representative microphotographs (H) and enumeration of lesional microvessels (I) in arteries are shown (n=6 each); HPF, high power field. (J) VEGFA transcripts in arteries were quantified using real-time polymerase chain reaction (RT-PCR); n=6 each. (K and L) Proliferating T cells in the tissue were identified by dual-color IF for CD3 (green) and Ki67 (red). Representative images (K) and total T cell numbers and proportions (L) of Ki67+ T cells in arteries are shown (n=6 each). (M) IFNG and GZMB mRNA was quantified in arteries by RT-PCR; n=6 each. Data are presented as mean ± SD with individual values given. Data were analyzed by paired t-test (C, G, I, L), one-way ANOVA with Tukey post hoc test (E), or Wilcoxon matched-pairs signed rank test (two-sided) (J, M). *P < 0.05, **P < 0.01, ***P < 0.001. Scale bars, 50 μm. IL-7R pos: IL-7R+, IL-7R neg: IL-7R−.

