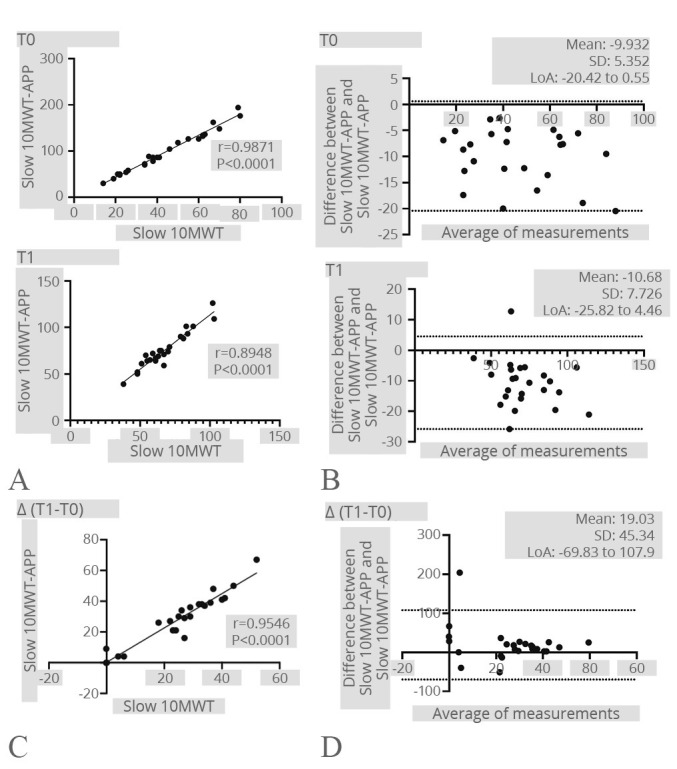
Figure 7.

—Slow 10MWT. A) Correlation between the Slow 10MWT and the Slow 10MWT-APP at both time points; B) Bland-Altman plot showing the level of agreement and the consistency of the two measurements at both time points; C) correlation between the difference of the Slow 10MWT results after the rehabilitation treatment registered by the operator and the Step-App® mobile system; D) Bland-Altman plot showing the level of agreement and the consistency of the two measurement difference after the rehabilitation treatment.
