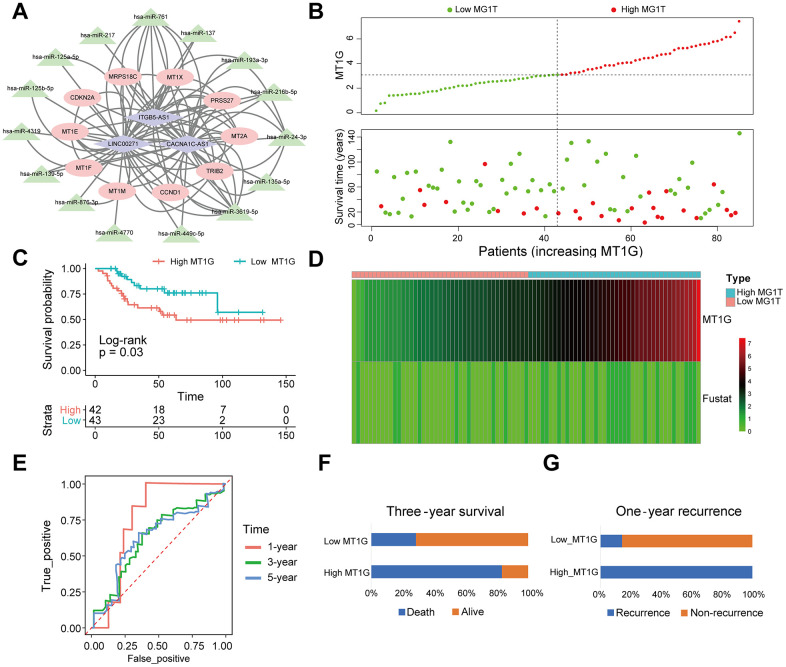
Figure 9.
MT1G-related ceRNA network construction and survival analysis. (A) A ceRNA network: blue diamond, lncRNAs; green triangle, miRNAs; red round, mRNAs. (B) Scatter plot of the expression of MT1G and OS patients’ survival time. (C) The KM curves of the high- and low-MT1G expression groups (D) Heatmap of the expression of MT1G and OS patients’ survival time. (E) Time-dependent ROC curve of MT1G expression in predicting OS overall survival. (F) Three-year survival of 13 OS patients with high or low MT1G expression. (G) One-year recurrence of 13 OS patients with high or low MT1G expression. (ns, p >0.05; *p <0.05; **p <0.01; ***p <0.001).

