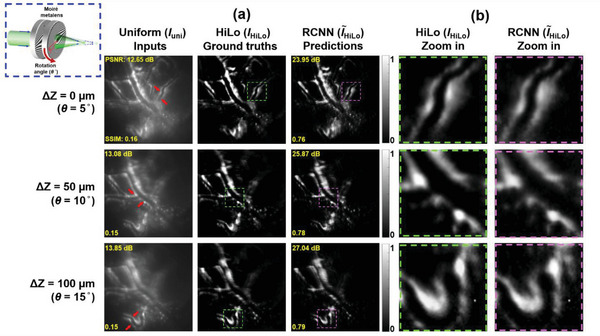
Figure 5.

In vivo fluorescence images of mouse brain. a) In vivo images of wide‐field, ground truth, and model predictions at three different depths (the corner dashed box show the rotation of Moiré metalens for the corresponding focal plane, and the arrows in I uni point out the focused area). b) Zoom in results corresponding to the dash square region in (a), the left column (green dash square), and the right column (purple dash square) show the I HiLo and HiLo zoom in images, respectively.
