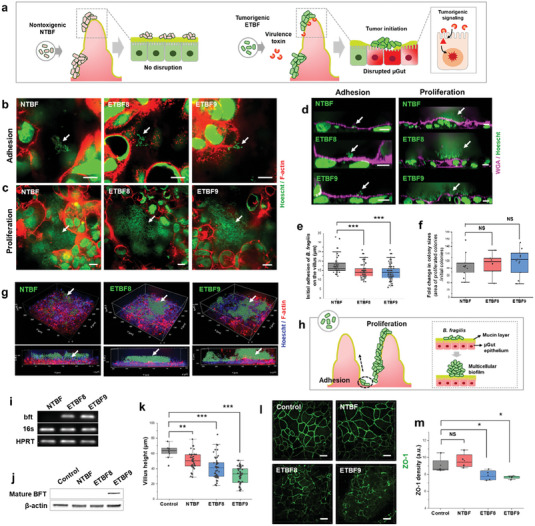
Figure 3.

The adhesion, growth, and development of pathogenic behavior of ETBF lead to disruptions in the 3D µGut. a) Schematics illustrating the varying degrees of µGut disruption induced by different strains of B. fragilis. b) Adhesion (3 h) and c) proliferation (24 h) of B. fragilis strains on the µGut surface. d) Immunofluorescence cross‐section images of the µGut‐ B. fragilis interface showing bacterial adhesion and proliferation on the mucin layer. e) Spatial distribution of B. fragilis strains along the crypt‐villus axis in the 3D µGut. f) Fold changes in colony sizes between adhesion and proliferation stages for various B. fragilis. g) 3D reconstruction, and h) an illustration of the µGut‐ B. fragilis interface, showcasing a multicellular bacterial biofilm formed on the µGut. i) Agarose gel electrophoresis of the bft PCR products, and j) Western blotting of mature BFT toxin (≈20 kDa) extracted from µGuts colonized by NTBF, ETBF8 and ETBF9. k) Changes in villi heights of the µGut colonized with various B. fragilis strains. l) ETBF induced ZO‐1 Redistribution, and m) its calculated density in the µGuts. P‐value indicate *p < 0.05; **p < 0.01; ***p < 0.001, NS→ p > 0.05. All scale bars represent 10 µm unless otherwise indicated.
