Figure 4.

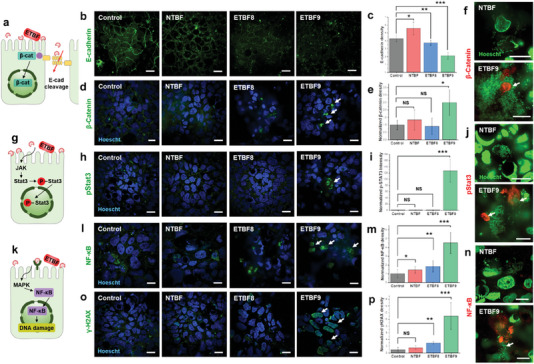
Activation of multiple tumorigenic signaling pathways induced by ETBF colonization in the µGut. a) A schematic of the BFT‐induced E‐cadherin cleavage and β‐catenin nuclear translocation triggered by ETBF colonization. b) Immunofluorescence confocal images and c) quantitative analysis of E‐cadherin density in B. fragilis colonized µGut. d) Immunofluorescence confocal images and e) quantitative analysis of β‐catenin nuclear translocation in B. fragilis colonized µGut. f) Magnified view (100x) of µGut epithelial cells surrounded by B. fragilis biofilm showing intense β‐catenin localization around ETBF9. g) A schematic of ETBF‐triggered pStat3 nuclear translocation. h) Immunofluorescence confocal imaging of pStat3 nuclear translocation and i) quantitative analysis of nuclear pStat3 density in B. fragilis colonized µGut. j) 100x view of NTBF and ETBF9 biofilm enclosed µGut epithelial cells displaying specific pSTAT3 translocation by ETBF9. k) A schematic of ETBF‐induced NF‐κB activation and nuclear translocation. l) NF‐κB nuclear translocation and m) nuclear NF‐κB density analysis in B. fragilis colonized µGuts imaged by immunofluorescence confocal microscopy. n) High‐magnification image (100x) of NF‐κB localization in µGut epithelial cells wrapped around NTBF and ETBF9. o) Immunofluorescence staining of γH2AX in µGut epithelium and p) quantitative analysis of cellular γH2AX density in B. fragilis colonized µGuts. All scale bars represent 10 µm. P‐value indicate *p < 0.05; **p < 0.01; ***p < 0.001, NS→ p > 0.05.
