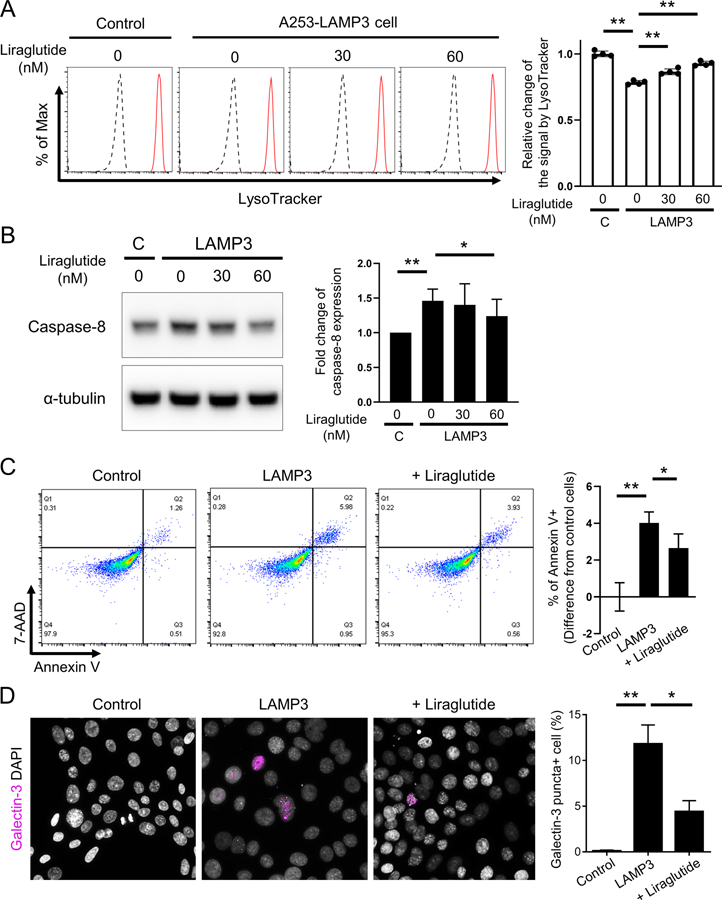
Figure 5. Restoration of lysosomal function prevents LAMP3-induced LMP and lysosome-dependent cell death via decrease in caspase-8 expression in vitro.

Control or LAMP3-overexpressing A253 cells were treated with liraglutide, an inducer of lysosomal biogenesis, at indicated concentration or vehicle control for 18 hours. (A) Flow cytometry using Lysotracker Deep Red (Black line: without Lysotracker; Red line: with Lysotracker) and bar chart showing mean fluorescent intensity. (B) Western blots showing caspase-8 and α-tubulin (internal control) expressions and bar chart showing relative change of caspase-8 expression normalized by α-tubulin expression. (C, D) Control or LAMP3-overexpressing A253 cells were treated with liraglutide at 60 nM or vehicle control for 18 hours. (C) Immunofluorescent images for galectin-3 (magenta) staining and bar chart showing percentage of galectin-3 puncta-positive cells. Original magnification: 40x. (D) Flow cytometry using APC-annexin V and 7-AAD and bar chart showing the difference in the rate of annexin V-positive cells from that in control cells. Values shown are mean ± SD (n = 4 for all experiments). *p < 0.05, **p < 0.01, t-test with Dunnett’s correction.
