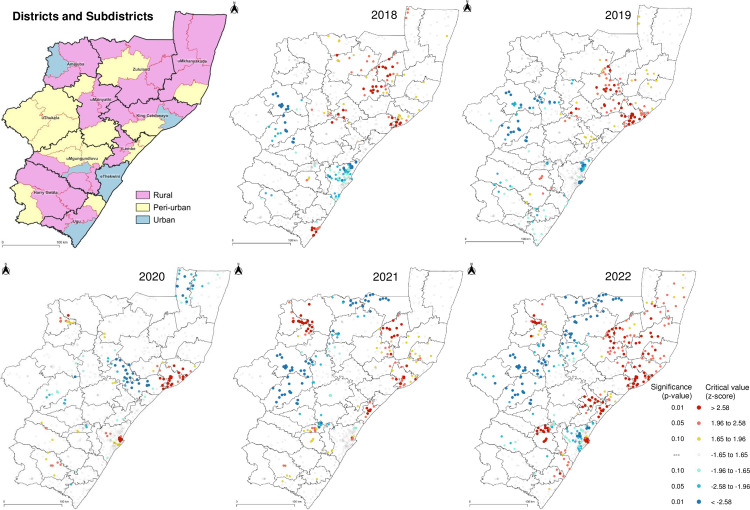
Fig 6. Hot- and coldspot analysis of HIV viral loads per facility in KwaZulu-Natal province, South Africa.
Getis-Ord Gi* hot- and coldspot statistical analysis of median log10 viral load mapped per facility. Red, orange and yellow circles reflect the statistical significance of primary, secondary and tertiary hotspots at 99%, 95% and 90% confidence intervals, respectively. Light to dark blue circles reflect the statistical significance of tertiary, secondary and primary coldspots at 90%, 95% and 99% confidence intervals, respectively. Thick and thin outlines represent the borders of districts and subdistricts, respectively. Republished from https://pinea.app.carto.com/map/4d4c56c1-f82d-4409-b190-ea9ced309005 under a CC BY license, with permission from Carto Builder user Lilishia Gounder, original copyright 2024.

