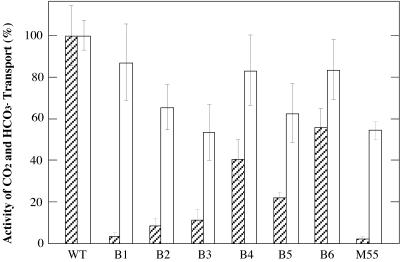
FIG. 2.
Amount of Ci taken up by the mutant cells during incubation with 14CO2 (hatched bars) for 10 s or with H14CO3− (open bars) for 20 s in the light. Each value is shown as a percentage of the value obtained for WT cells (259 nmol of CO2/mg of Chl per 10 s and 473 nmol of HCO3−/mg of Chl per 20 s), and the error bars indicate standard deviations (n = 3). Cells grown at pH 8.0 were suspended in the same medium as for Fig. 1.

