. 2024 May 28;12:RP84855. doi: 10.7554/eLife.84855

Figure 2. Speakers predicted to be men are sometimes over-represented in quotes, but this depends on the year and article type.

(a), left, depicts an example of the names extracted from quoted speakers in news articles and authors in papers. (a), right, highlighted the data types and processes used to analyze the predicted gender of extracted names. (b) shows an overview of the number of quotes extracted for each article type. (c) depicts three trend lines: purple: proportion of quotes for a speaker estimated to be a man; light blue: proportion of first author papers estimated to be a man; dark blue: proportion of last authors predicted to be a man. We observe that the proportion of quotes estimated to come from a man is steadily decreasing, most notably from 2017 onward. This decreasing trend is not due to a change in quotes from the first or last author, as observed in (d). (d) shows a consistent but slight bias toward quoting the last author of a cited article than the first author over time. (e) depicts the frequency of quote by article type highlighting an increase in quotes from ‘Career Feature’ articles. (e) depicts that the quotes obtained in this article type have reached parity. The colored bands represent a 5th and 95th bootstrap quantiles in all plots, and the point is the mean calculated from 1000 bootstrap samples.

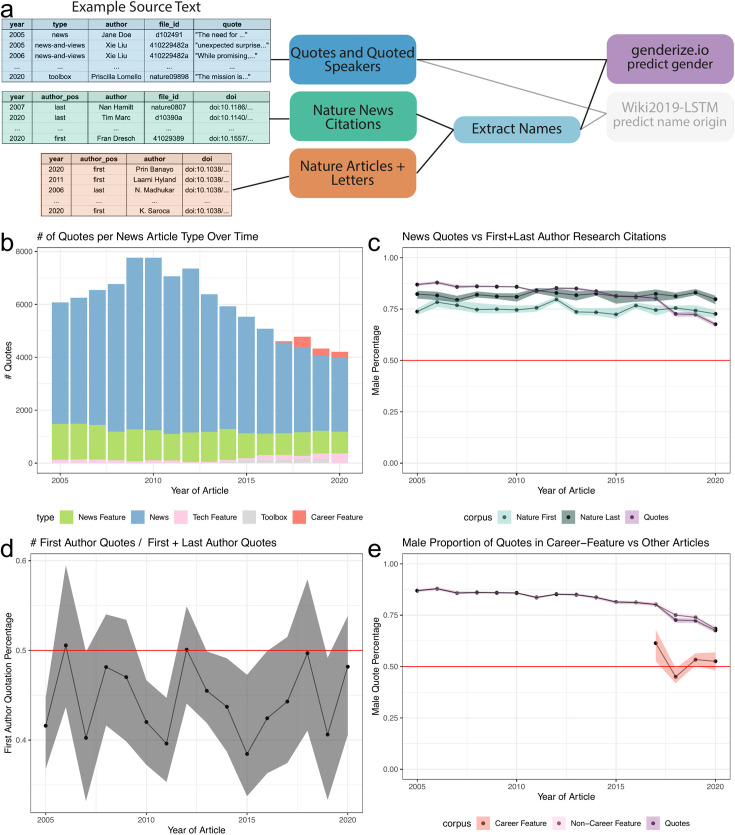
Figure 2.

Figure 2—figure supplement 1. Speakers predicted to be men are over-represented in news quotes regardless of predicted journalist gender.

Figure 2—figure supplement 1.

(a) depicts two trend lines: Yellow: proportion of Nature news articles written by a predicted women journalist; blue: proportion of Nature news articles written by a predicted men journalist. We observe a moderate gender difference in the number of articles written by men and women journalists. (b) depicts two trend lines: yellow: proportion of quotes predicted to be from men in an article written by a journalist predicted to be a woman; blue: proportion of quotes predicted to be from men in an article written by a journalist predicted to be a man. In all plots, the colored bands represent the 5th and 95th bootstrap quantiles and the point is the mean calculated from 1000 bootstrap samples.
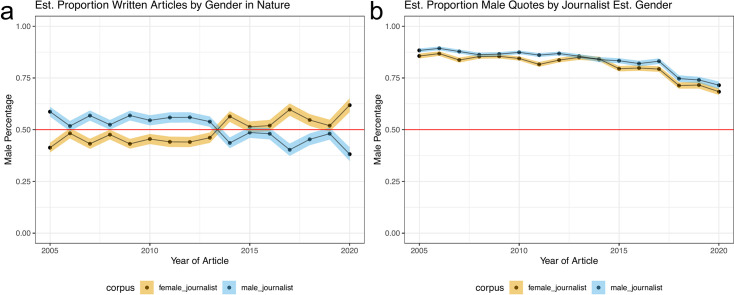
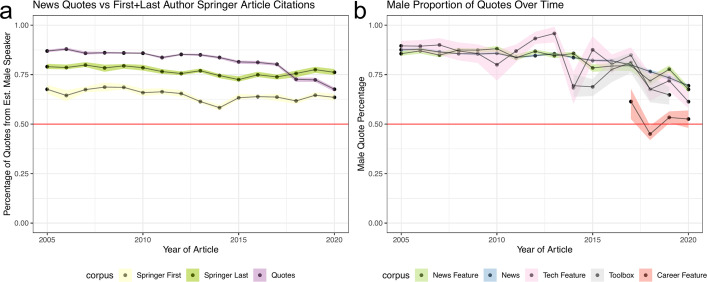
Figure 2—figure supplement 2. Speakers predicted to be men are over-represented in news quotes when compared against Springer Nature authorship.

Figure 2—figure supplement 2.

(a) depicts three trend lines: purple: proportion of Nature quotes for a speaker estimated to be a man; light gray: proportion of The Guardian quotes for a speaker estimated to be a man; yellow: proportion of first author articles from an author estimated to be a man in Springer Nature; dark mustard: proportion of last author articles from an author estimated to be a man in Springer Nature. We observe a larger gender difference between first and last authors in Springer Nature articles, however the proportion of speakers estimated to be men is less than observed in Nature research articles. (b) depicts the proportion of quotes from predicted men broken down by article type. In all plots, the colored bands represent the 5th and 95th bootstrap quantiles and the point is the mean calculated from 1000 bootstrap samples.