
Figure 2. Survival of rBCG::iE-DAP in IFNγ activated bone marrow derived macrophages (BMDMs), training of monocytes and activation with doxycycline.
(A) IFNγ-activated BMDMs (1x10⁶ cells) were infected at MOI: 1 with WT BCG and rBCG::iE-DAP. ATc was added to culture media for induction of the CRISPRi system in rBCG::iE-DAP at concentrations ranging from 100 ng/ml – 500 ng/ml and growth of the strains was assessed after 3 and 5 days. (B) Training of U937 monocytes with heat-killed (HK)-rBCG::iE-DAP compared to HK-WT BCG. Shown is also the representative plates for the experiment. (C, D) CFU counts of in vitro grown WT BCG and of rBCG::iE-DAP grown in complete 7H9 medium at varying concentrations of Dox. (E) Determination of the Dox concentration for activation of rBCG::iE-DAP in vivo. Mice were aerosol infected with ~2.5 log10 CFU of rBCG and Dox (0.125–1 mg/kg/day) - was administered by oral gavage for 10 days. (F, G) CFU counts from the experiment shown in panel E. Lung homogenates were plated on both 7H11 with (G) and without (F) kanamycin (25 µg/ml) to assess the loss of the CRISPRi plasmid during in vivo growth. p-values are given above the graphs. (H) Aerosol infection of mice with ~2.5 log10 CFU of WT BCG, rBCG::iE-DAP and administration of Dox (1 mg/kg/day) for 8 weeks. (I) Plates showing the colony size of rBCG::iE-DAP+Dox compared to WT BCG or WT BCG+Dox, recovered from the lungs of aerosol infected mice from the experiment shown in panel H. Three independent biological repeats (n=3) were assessed for the in vitro experiments, the error bars represent the standard deviation relative to the mean. Five mice per group (n=5) were used for the in vivo experiments. Student t-test was used for statistical analysis. The error bars represent the standard deviation relative to the mean. *: p-value <0.05.

Figure 2—figure supplement 1. Analysis of secreted TNFα levels from non-activated and IFN-activated BMDMs infected with WT BCG and rBCG::iE-DAP at MOI 1:20.
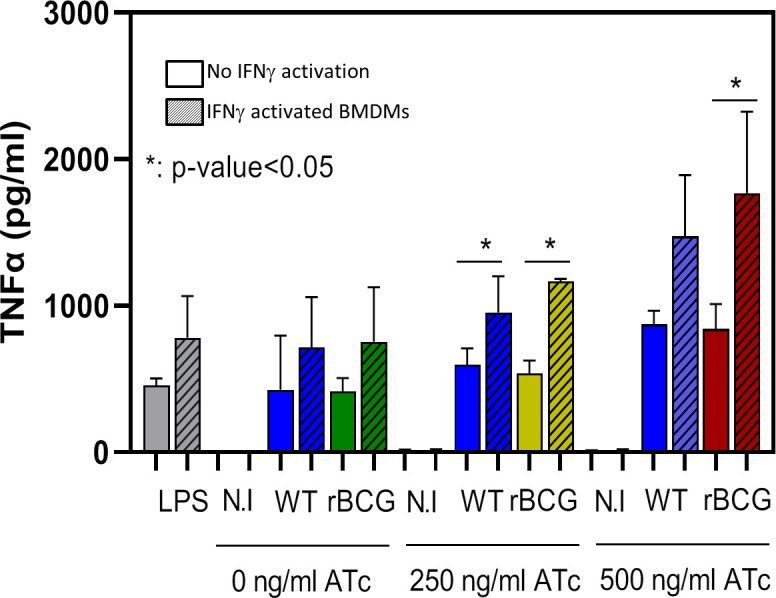
Figure 2—figure supplement 2. Efficacy of 1 mg/kg/day dose of doxycycline for CRISPRi activation.
