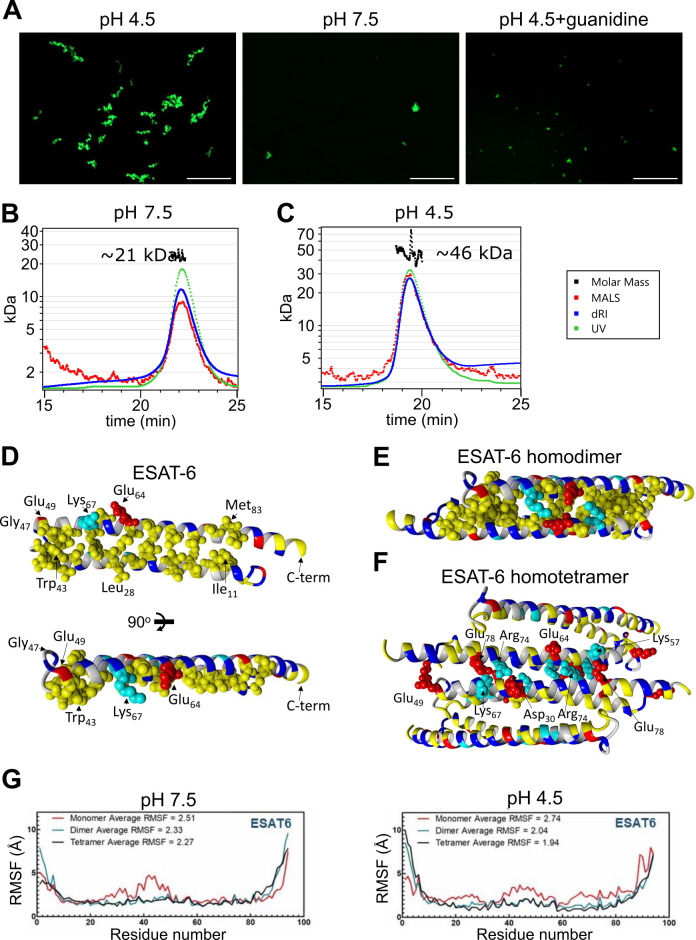
Figure 5. Stoichiometry of ESAT-6 self-interaction.
(A) Fluorescence microscopy showing fluorescently labeled ESAT-6 complexes under different conditions: pH 4.5, pH 7.5, and pH 4.5+6 M guanidine. The images shown are representative of three replicates. Size exclusion chromatography followed by multi-angle light scattering (SEC-MALS) traces showing UV absorbance, refractive index (dRI), and MALS data along with calculated molar mass over the peak at pH 7.5 (B), and pH 4.5 (C). Data in (B–C) is representative of three replicates. (D–F) Modeling of ESAT-6 in monomeric (D), homodimeric (E), and homotetrameric form (F). Hydrophobic residues are in yellow, polar residues are in blue, basic residues are in cyan, and acidic residues are in red. Key side chain residues are shown as spheres. (G) Root mean square fluctuation (RMSF) values are shown per residue for ESAT-6 monomer, dimer, and trimer at pH 7.5 and 4.5.

