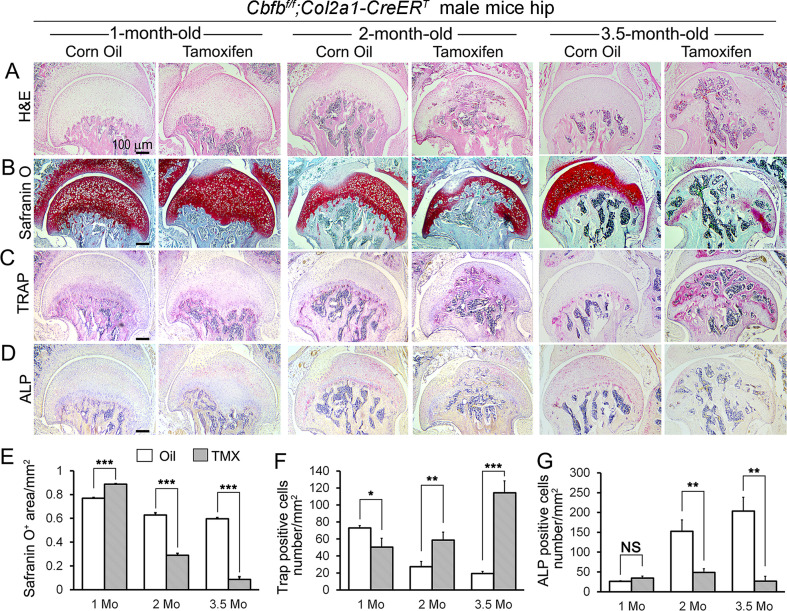
Figure 2. Cbfb deletion in Col2a1-CreERT mice cartilage resulted in more severe OA-like phenotype 3.5-month-old mutant mice with increased osteoclasts and subchondral bone hyperplasia, decreased articular cartilage and osteoblasts.
(A–D) H&E staining (A), SO staining (B), TRAP staining (C), and ALP staining (D) of 1-month-old, 2-month-old, and 3.5-month-old male Cbfbf/f;Col2a1-CreERT mice hips respectively. (E) Quantification of SO red area of (B). Data was measured by ImageJ. (F) Quantification of TRAP-positive cell numbers of (C). (G) Quantification of ALP-positive cell numbers of (D). TMX = Tamoxifen, Cbfb deleted group; Oil = Corn Oil, control group. n=7. Data are shown as mean ± SD. NS, no significance; *p<0.05; **p<0.01; ***p<0.001 vs. controls by Student’s t-test. Scale bar: 100 μm.

