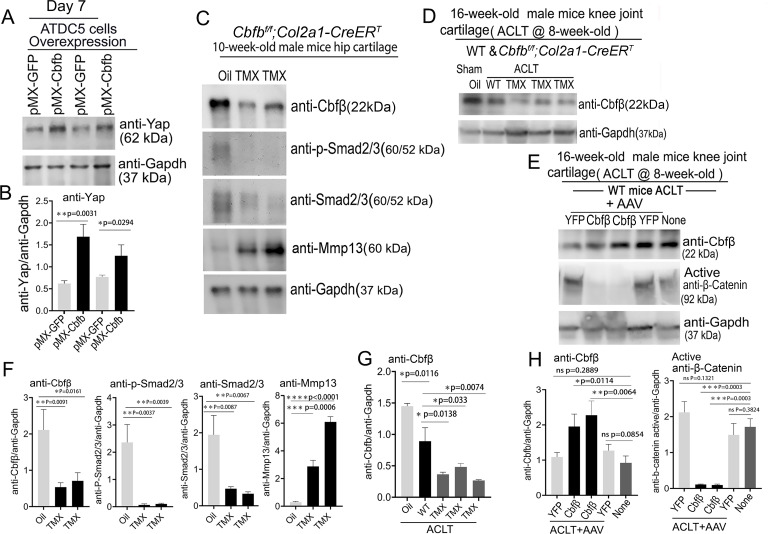
Figure 8. Deficiency of Cbfβ protein levels increased β-catenin and articular cartilage degradation markers while also reducing Yap signaling activation.
(A) Western blot showing protein expression level of Yap in ATDC5 cells (n=3). (B) Quantification of Yap protein levels in (A). (C) Western blot of 10-week-old male hip cartilage from Cbfbf/f;Col2a1-CreERT mice injected with either oil or TMX showing the expression of Cbfβ, p-Smad2/3, Smad2/3, and Mmp13 (n=5). (D) Western blot of knee joint cartilage from 16-week-old male WT and Cbfbf/f;Col2a1-CreERT mice with ACLT surgery and injected with either oil or TMX showing the expression of Cbfβ (n=6). (E) Western blot of WT mice knee joint cartilage from 16-week-old male mice with ACLT surgery, treated with AAV-luc-YFP or AAV-Cbfb, and injected with either oil or TMX showing the expression of Cbfβ and active β-catenin (n=6). (F) Quantification of (C). (G) Quantification of (D). (H) Quantification of (E). Data are shown as mean ± SD. *p<0.05, **p<0.01, ***p<0.001. NS Not Significant.


