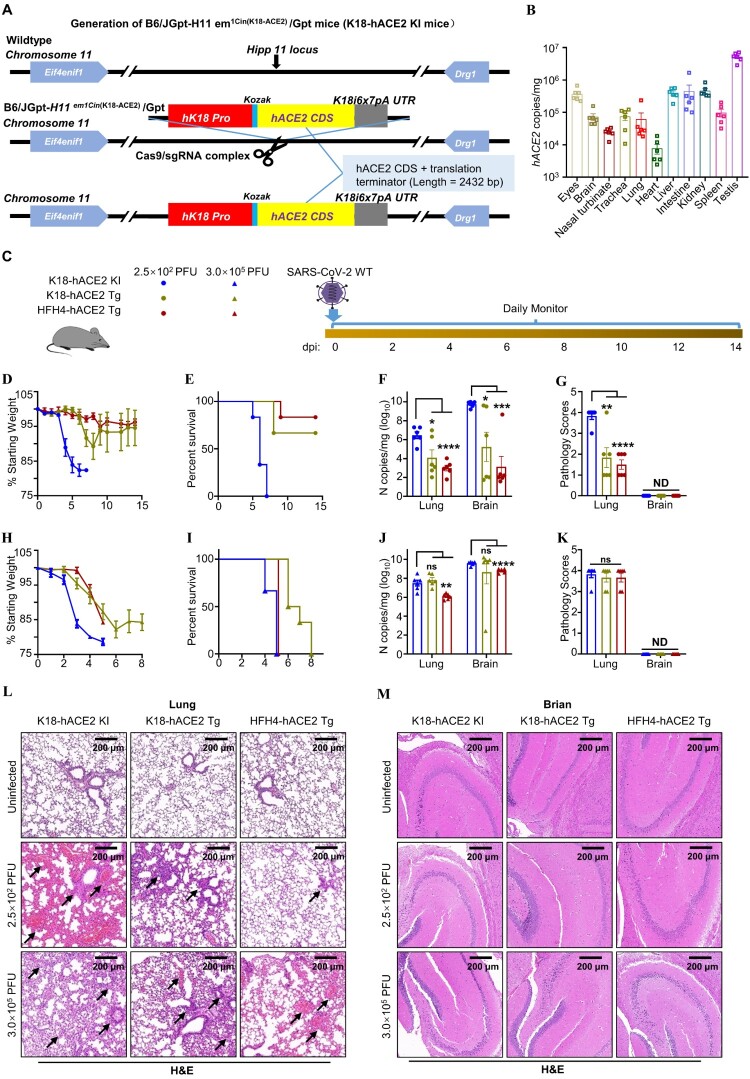
Figure 1.
The comparison of outcomes of the hACE2 mouse models to SARS-CoV-2 infection. (A) Generation of K18-hACE2 KI mice. The element containing the K18 promoter, the human ACE2 (hACE2) coding sequence, was inserted into the Hipp11 locus, which can drive the epithelial cell-specific expression of hACE2. (B) hACE2 distribution in the tissues of K18-hACE2 KI mice. K18-hACE2 KI mice (n = 6) were euthanized, and the indicated tissues were collected to measure hACE2 mRNA levels via absolute quantification RT-PCR. hACE2 copy numbers were normalized as copies per milligram of tissue. (C) Schematic for SARS-CoV-2 infection. Twelve – to eighteen-week-old K18-hACE2 KI, B6.Cg-Tg(K18-hACE2)2Prlmn/J (K18-hACE2 Tg) and HFH4-hACE2 Tg mice were anesthetized, followed by intranasal inoculation with 2.5 × 10² or 3.0 × 10⁵ PFU of SARS-CoV-2 wild-type (WT). Infected mice were monitored and evaluated at the indicated time for (D, H) body weight changes (n = 6) and (E, I) survival (n = 6), and were then sacrificed to harvest samples at the endpoint of experiment. Mice that lost over 20% of their starting body weight were euthanized. (F, J) Viral N gene copy numbers were measured by absolute quantification RT-PCR in the lungs and the brains. (G, K) Pathology scoring on lung and brain tissues. (L, M) H&E staining of lung and brain tissues obtained from K18-hACE2 KI, K18-hACE2 Tg or HFH4-hACE2 Tg mice following SARS-CoV-2 WT infection. The black arrow indicates the lung tissue damages. One-way ANOVA with Tukey’s multiple comparison test was used. ****, P < 0.0001; ***, P < 0.001; **, P < 0.01; *, P < 0.05; ns, not significant, P > 0.05. Error bars represent the means with SEMs in (B), (D) and (H), and the means with SDs elsewhere. ND, not detected.

