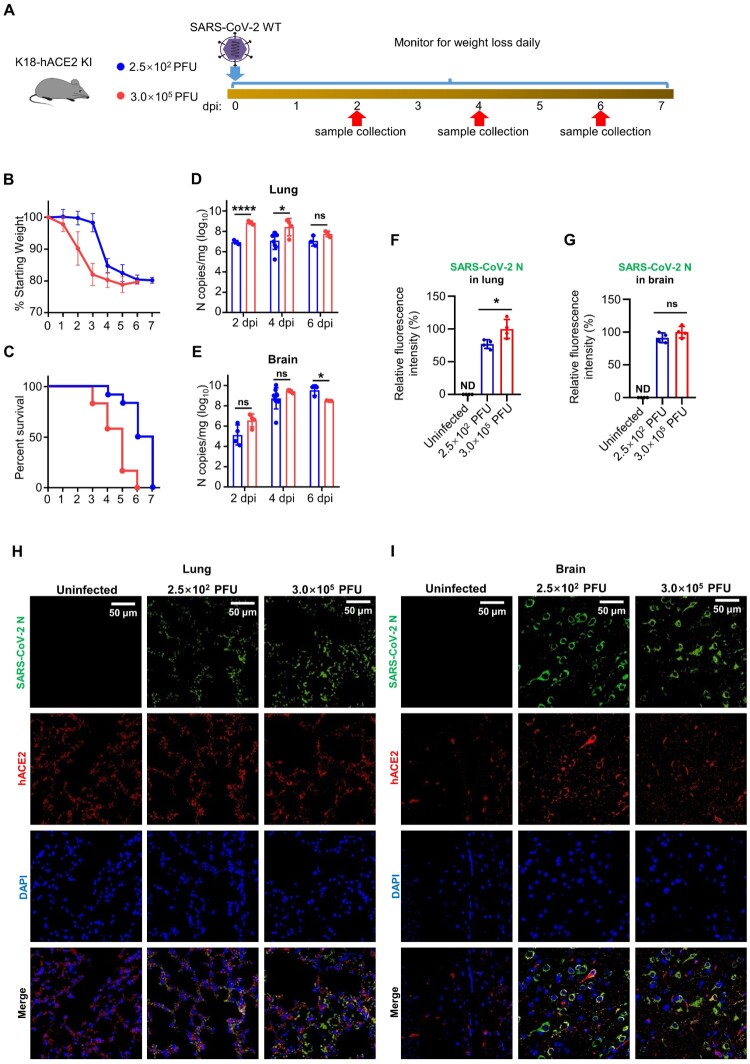
Figure 2.
SARS-CoV-2 infection in K18-hACE2 KI results in a lethal infection. (A) Schematic for SARS-CoV-2 infection. Twelve – to eighteen-week-old male and female K18-hACE2 KI mice were anesthetized, followed by intranasal inoculation with 2.5 × 10² or 3.0 × 10⁵ PFU of SARS-CoV-2. Infected mice were monitored and evaluated at the indicated time for (B) body weight changes (n = 12) and (C) survival (n = 12). At 2, 4, and 6 dpi, at least 3 mice per group were sacrificed to harvest samples, and viral N gene copy numbers in (D) the lungs and (E) the brains were measured by absolute quantification RT-PCR. Mice that lost over 20% of their starting body weight were euthanized. (F) to (I) Immunofluorescence quantification and analysis of hACE2 and SARS-CoV-2 N protein in the lungs and the brains of K18-hACE2 KI mice. In (H) and (I), left panel, the uninfected group; middle panel, the group infected with 2.5 × 10² PFU of SARS-CoV-2 WT at 4 dpi; right panel, the group infected with 3 × 10⁵ PFU of SARS-CoV-2 WT at 4 dpi. Green, SARS-CoV N protein; red, hACE2; blue, DAPI. The scale bar is shown in each section. Two-way ANOVA with Tukey’s multiple comparison test was used in (D) and (E), ****, P < 0.0001; *, P < 0.05; ns, not significant, P > 0.05. Unpair Student’s t test was used in (F) and (G), *, P < 0.05; ns, not significant, P > 0.05; ND, not detected. Error bars represent the means with SEMs in (B) and the means with SDs elsewhere.

